[This is a living document]
Tea Den Aging Project Goals:
- Accurate representation of variables influencing tea aging
- Accurate visual representation of tea aging over time
- Subjective perspective of tea aging over time
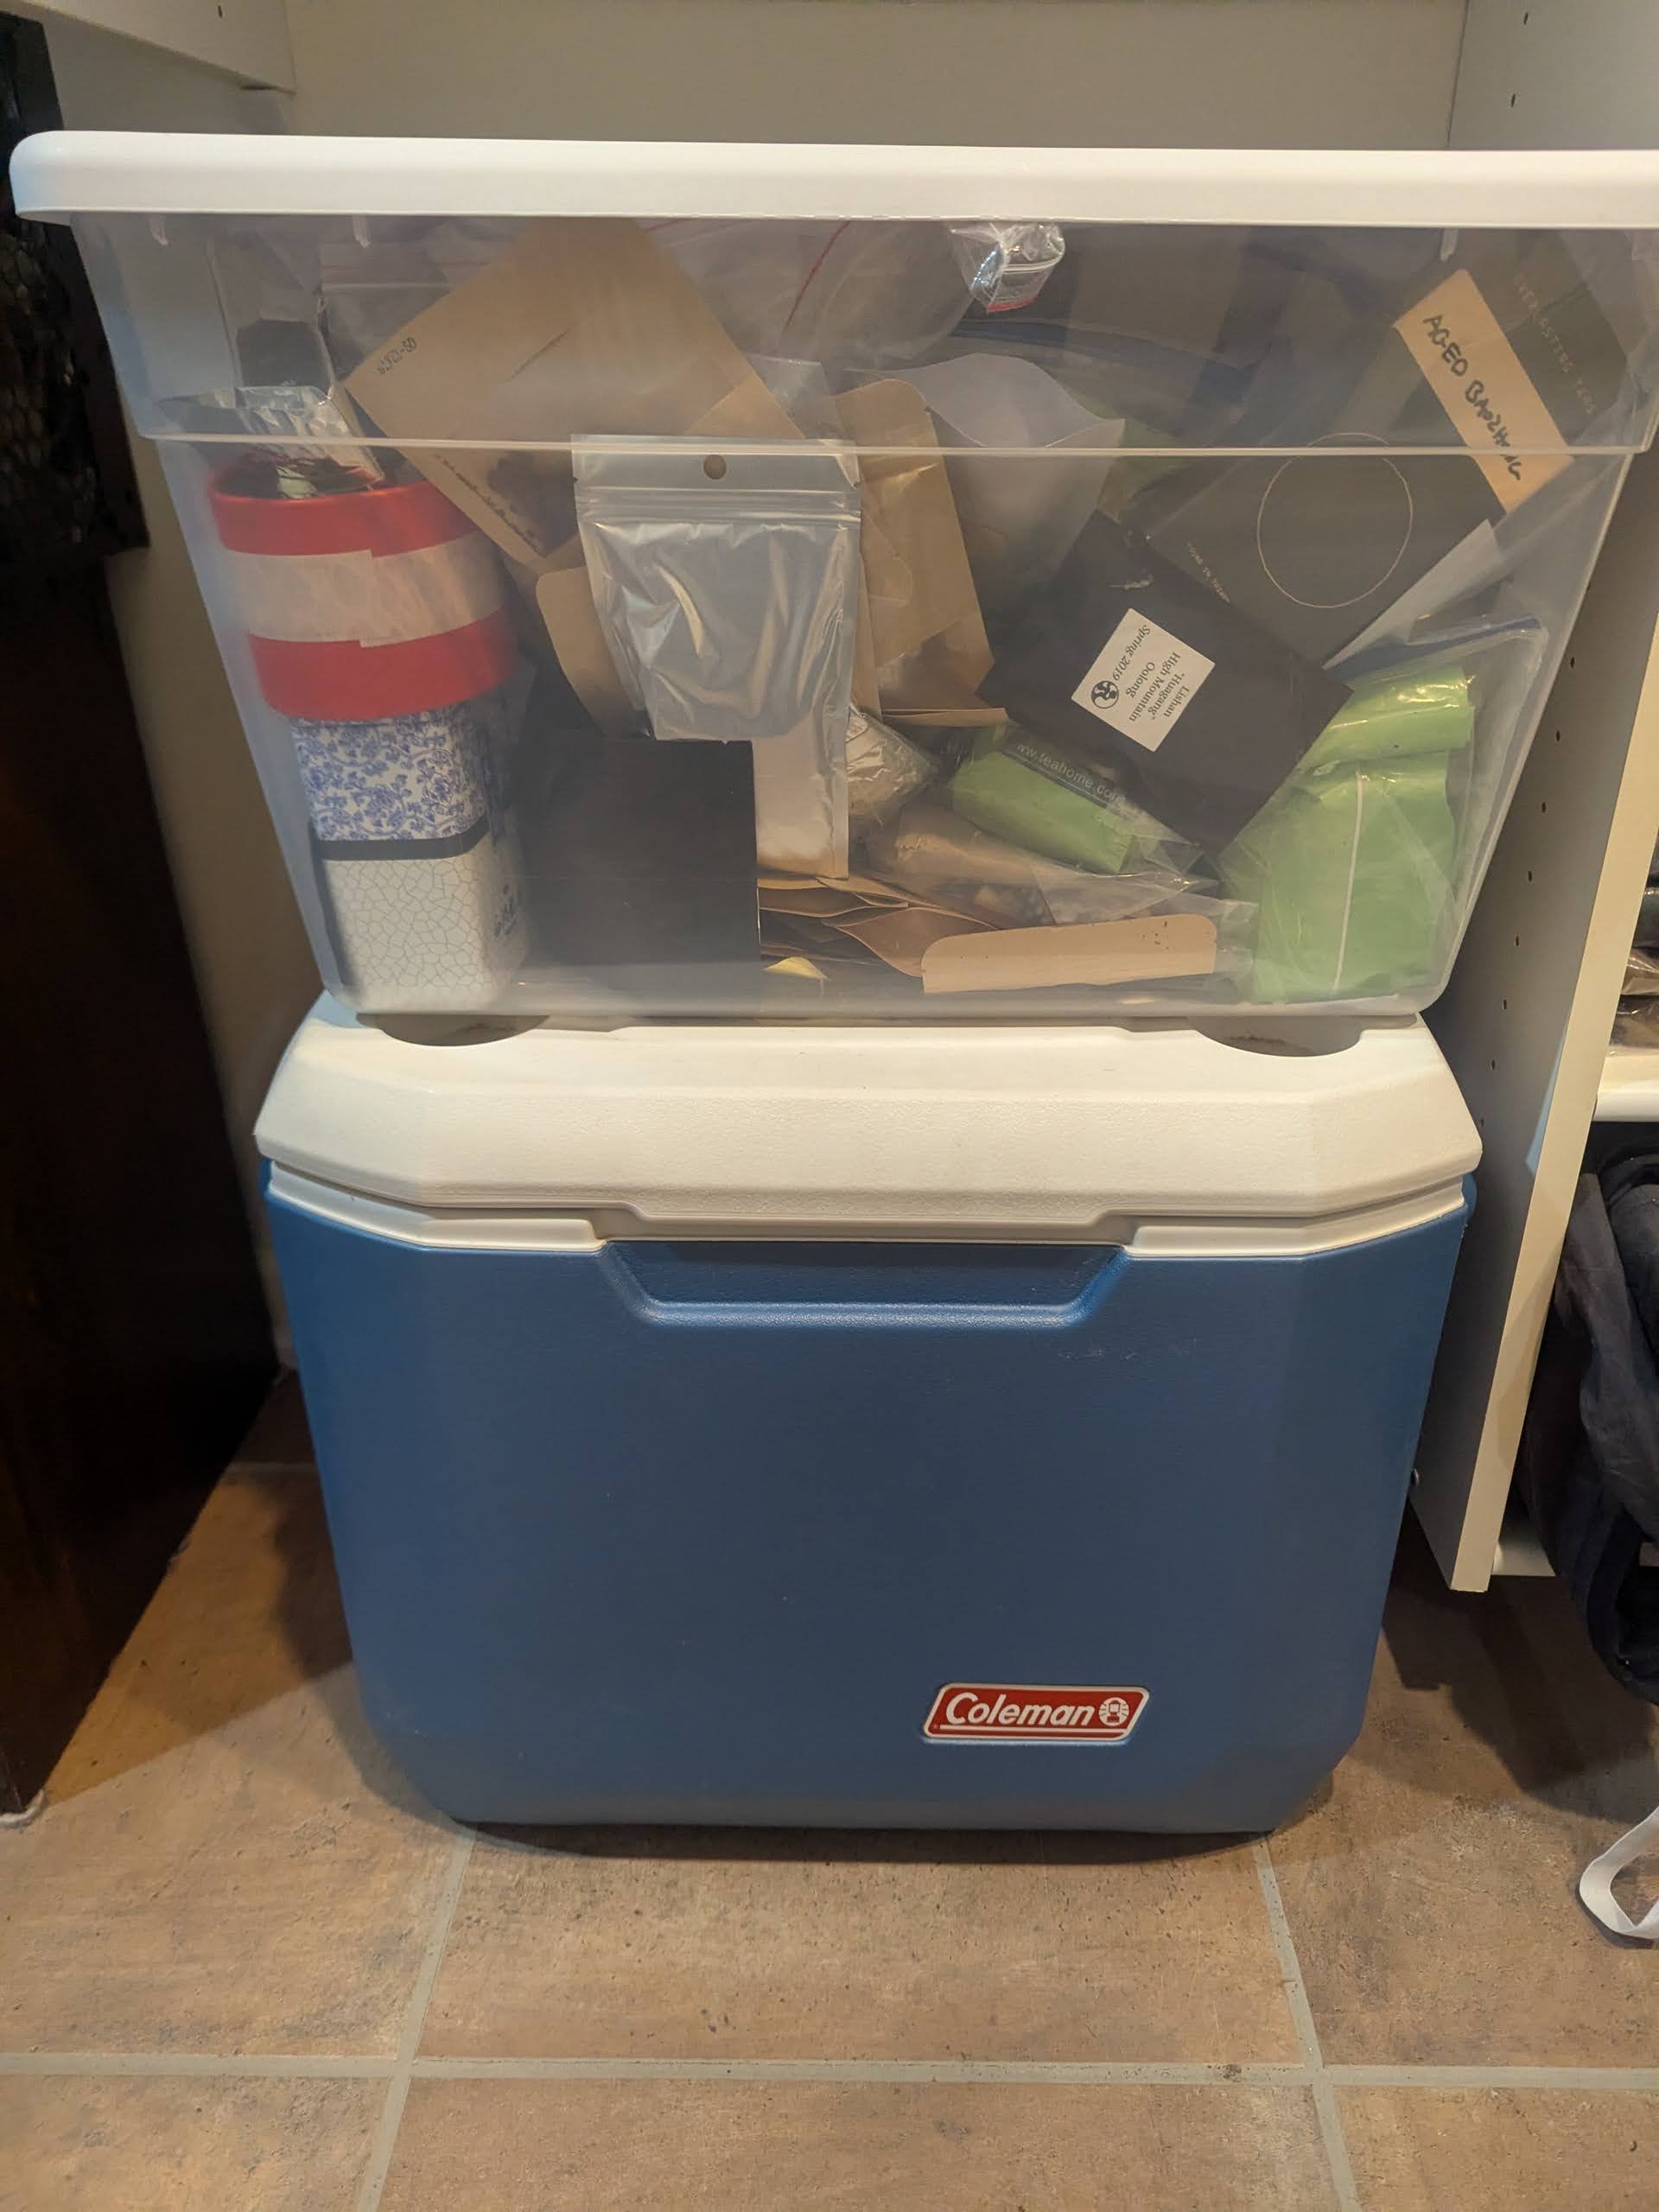
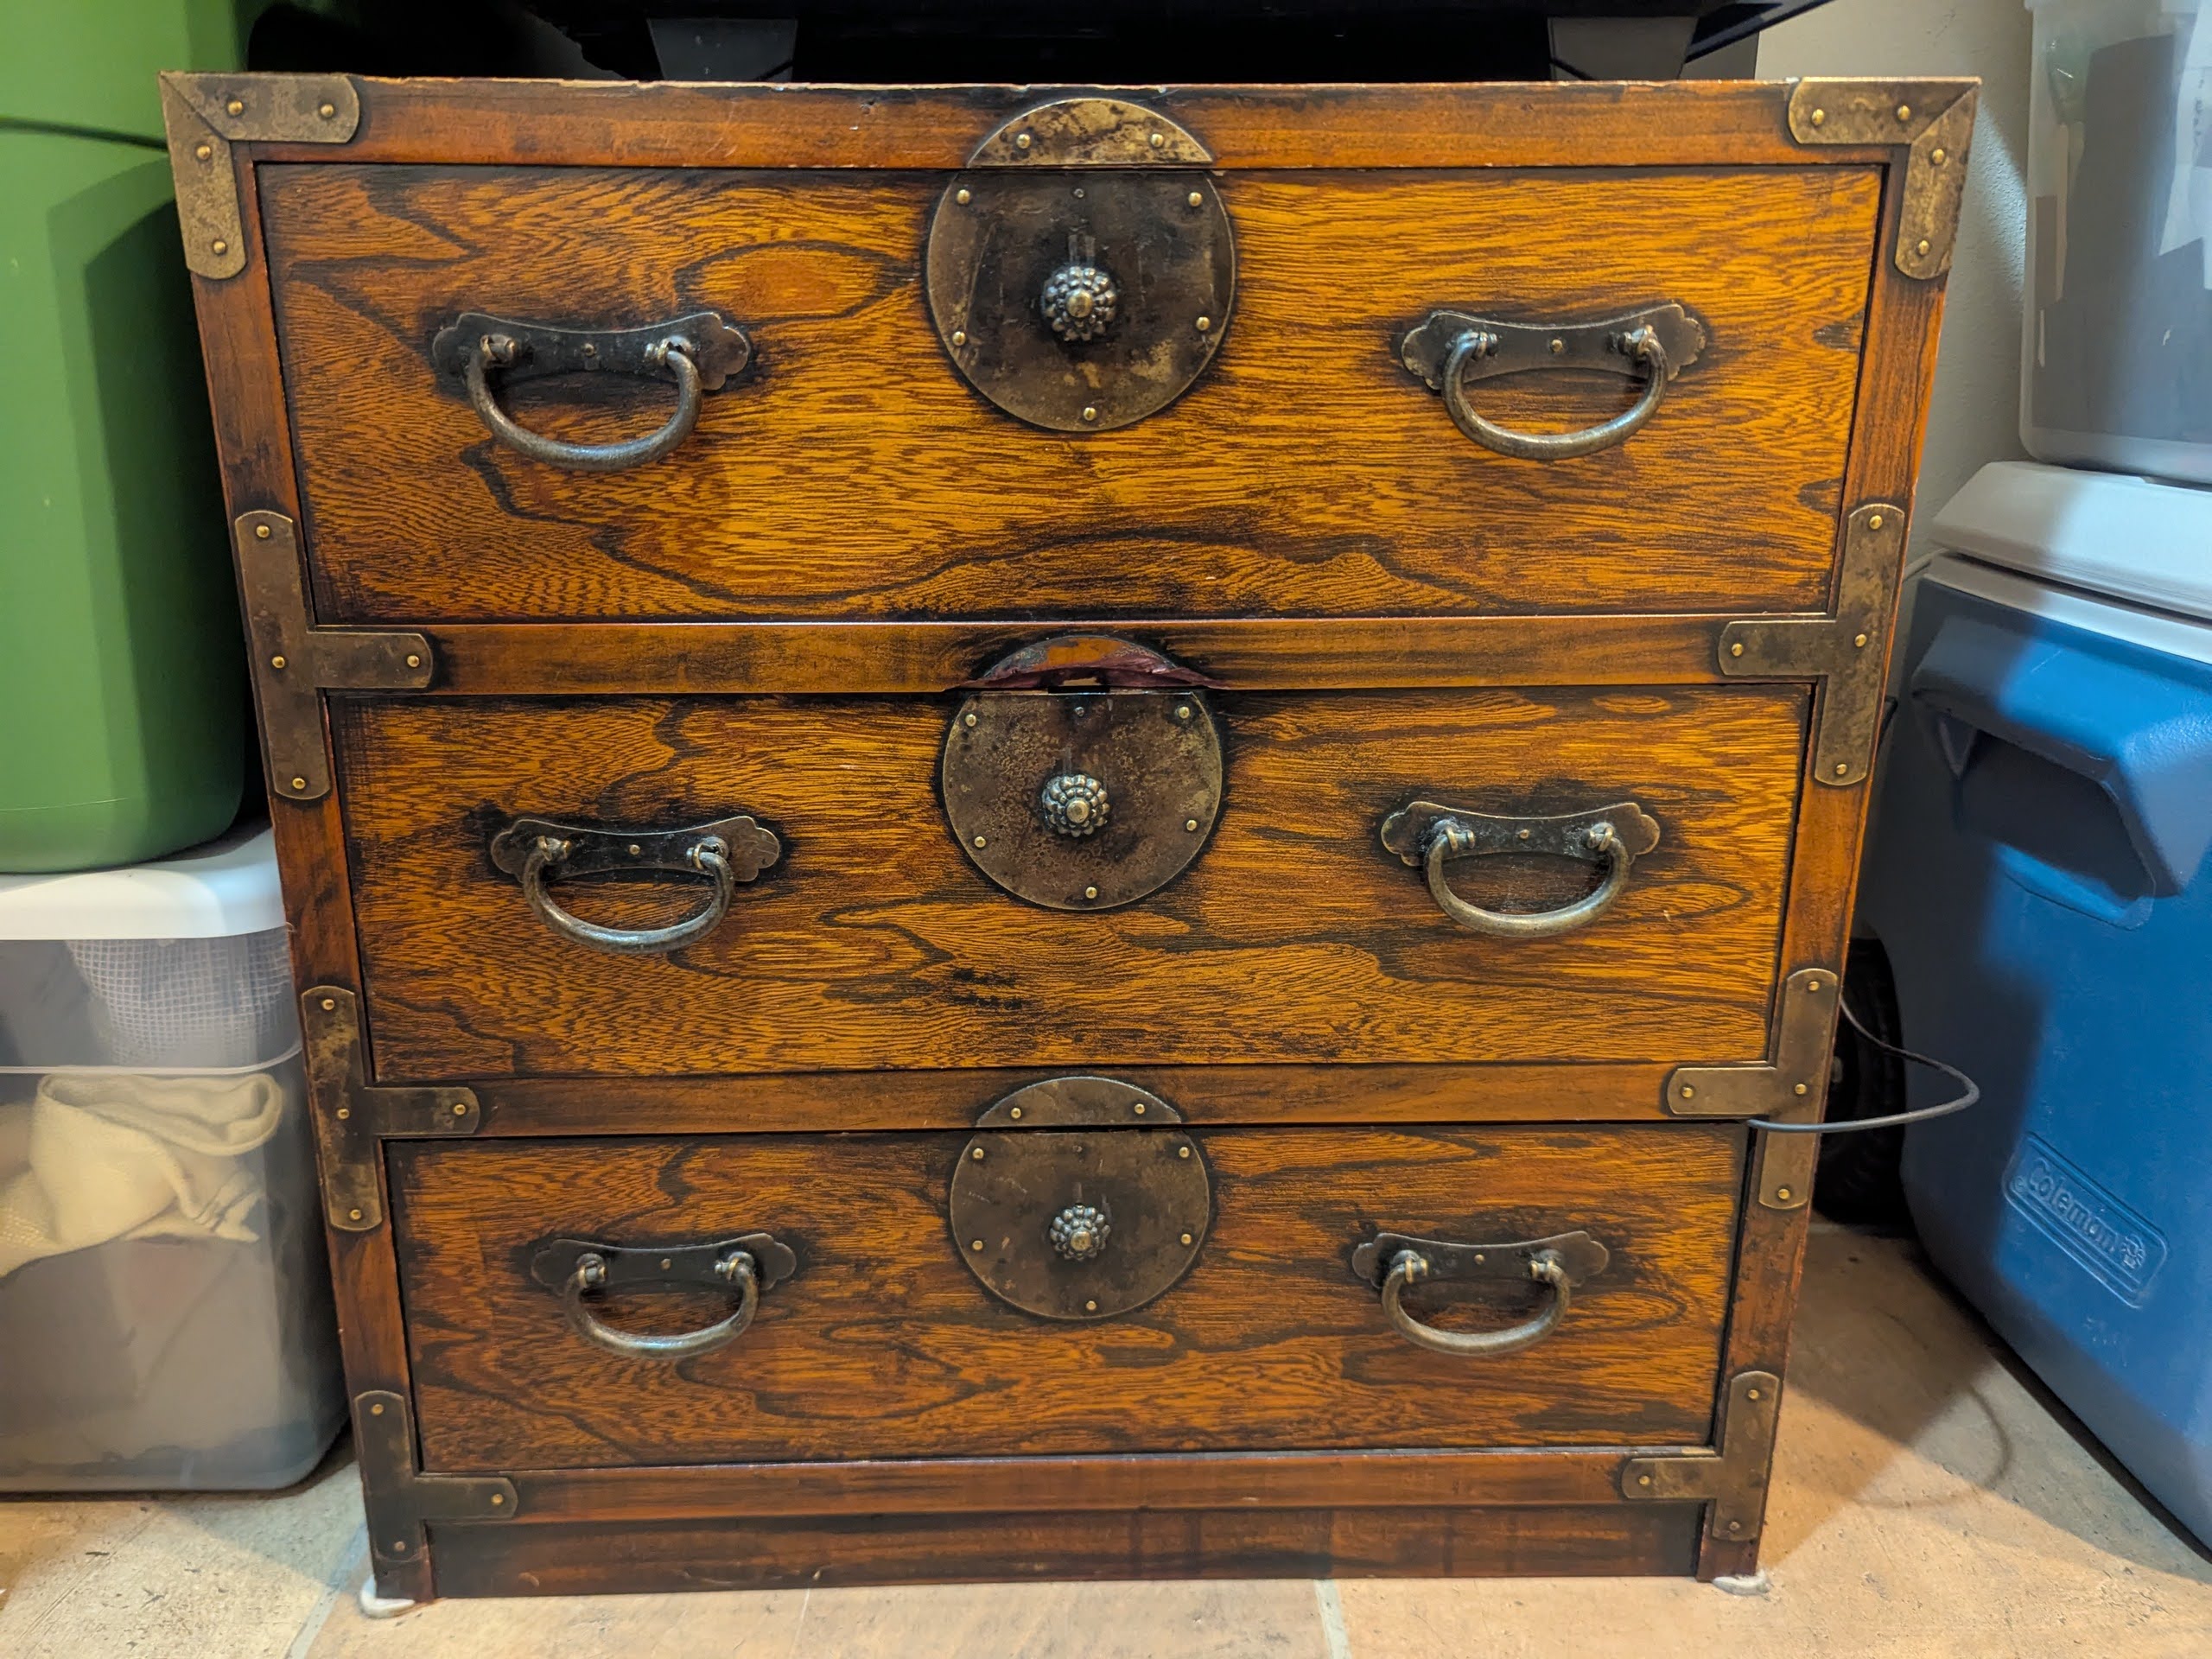
Creating a “Smart” Pumidor
Materials & Tools:
-
- HomeAssistant
- Wifi Smart Socket
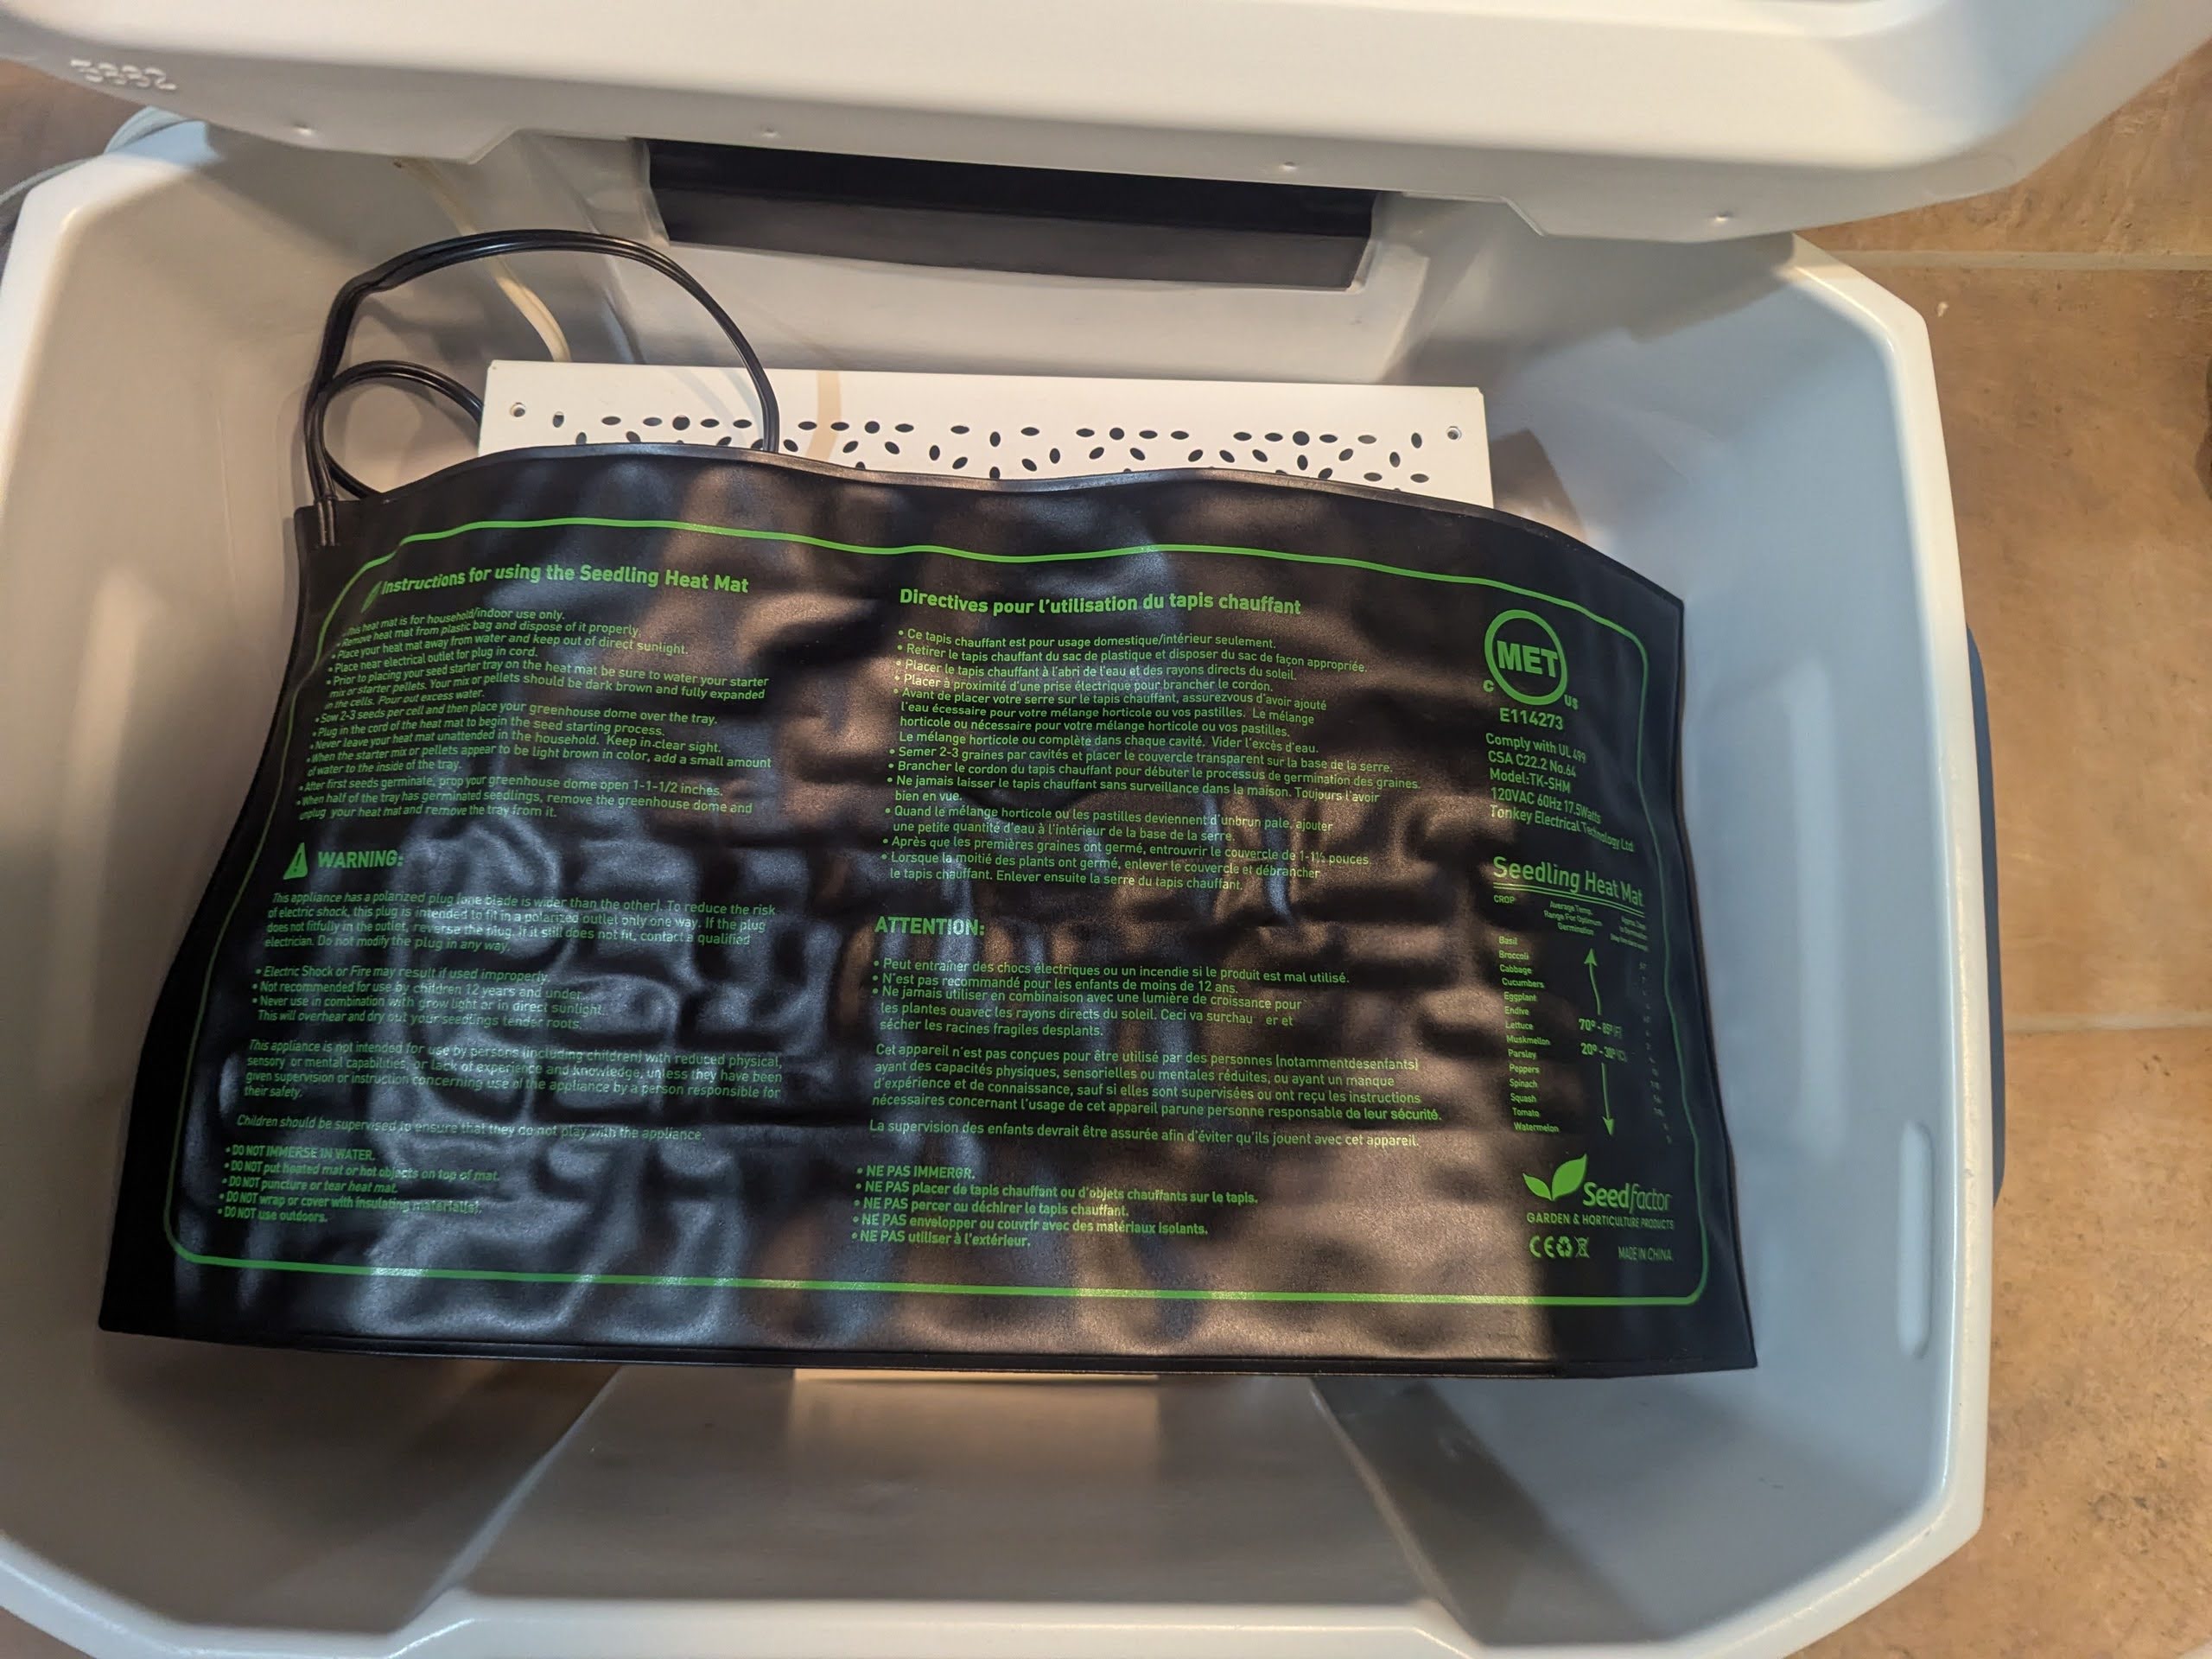
Zigbee Humidity & Temperature Sensor- Seedling Heating Mat
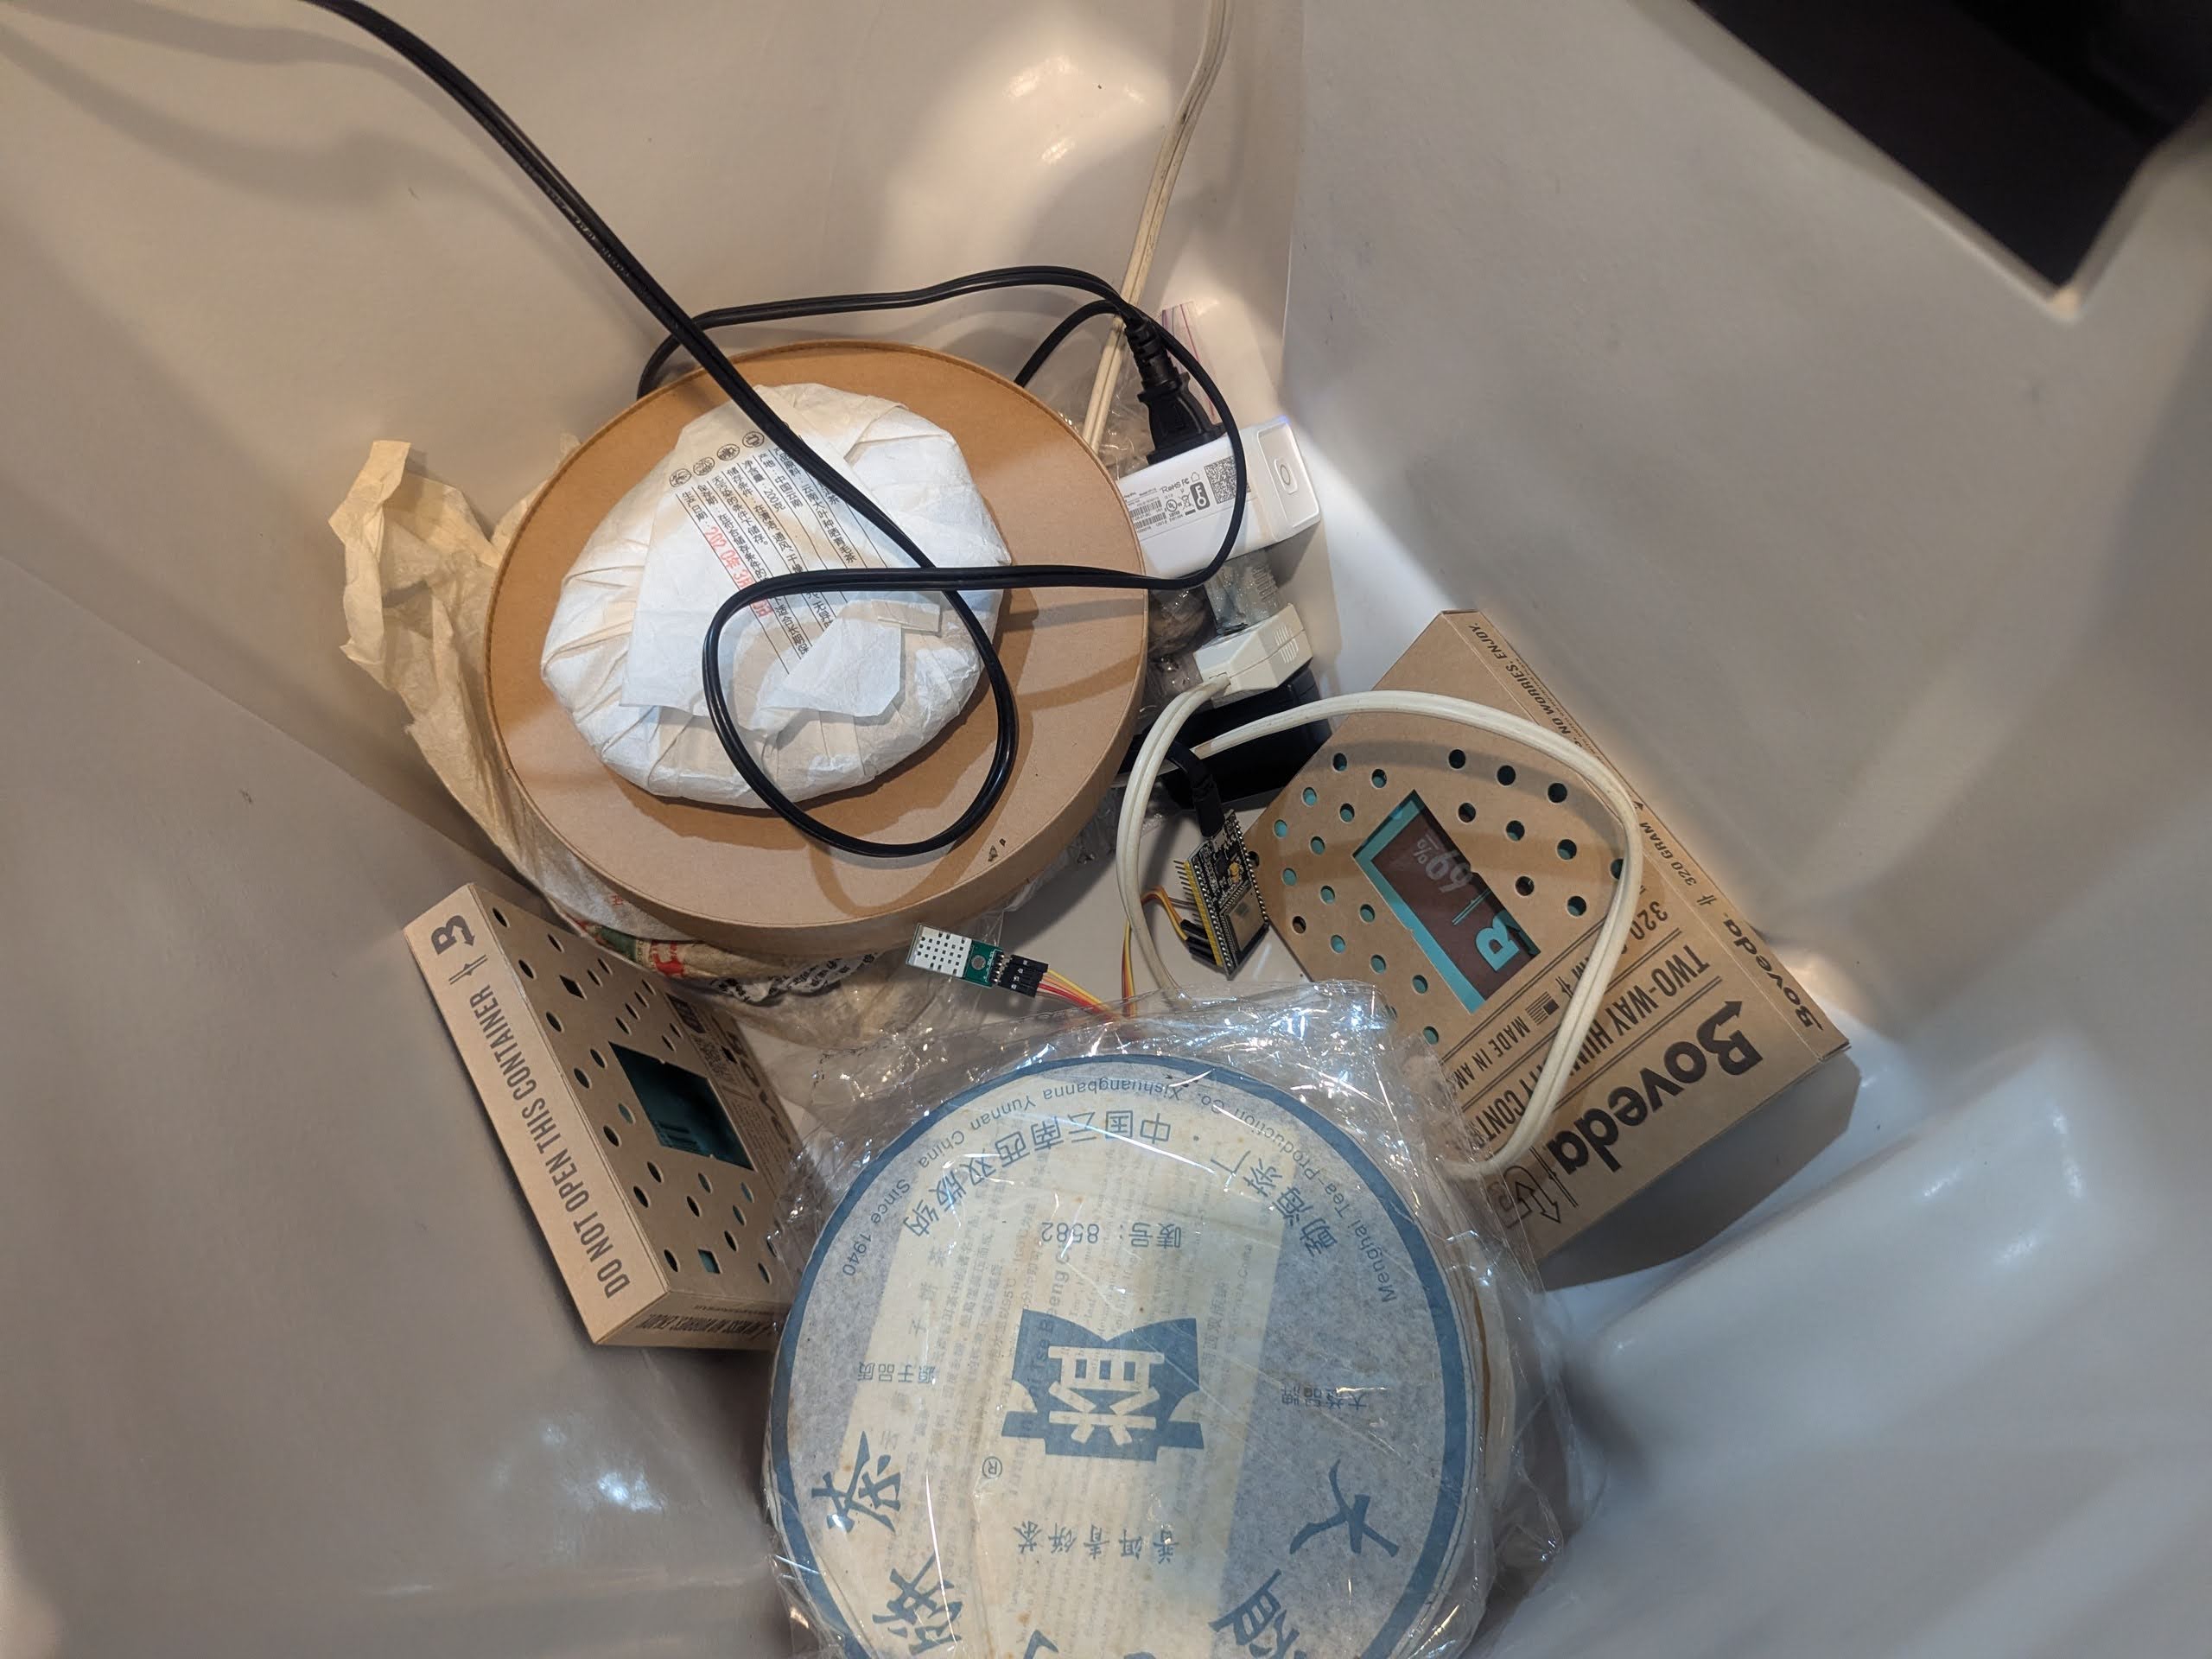
- Boveda 65% Two-Way Humidity Control Pack, Size 320
- Insulation
- NodeMCU ESP32 SBC
- SHTC3 Temperature and Humidity Sensor
Version 1: Zigbee sensors
I used a Zigbee-protocol humidity and temperature sensor to start (the square device in there). While zigbee is great for household lights, zigbee devices work best in a tight mesh with amplifier or repeaters within the system. As my pumidor is far away from other zigbee devices, the quality of the signal was iffy at best, and the sensors in this device aren’t great.
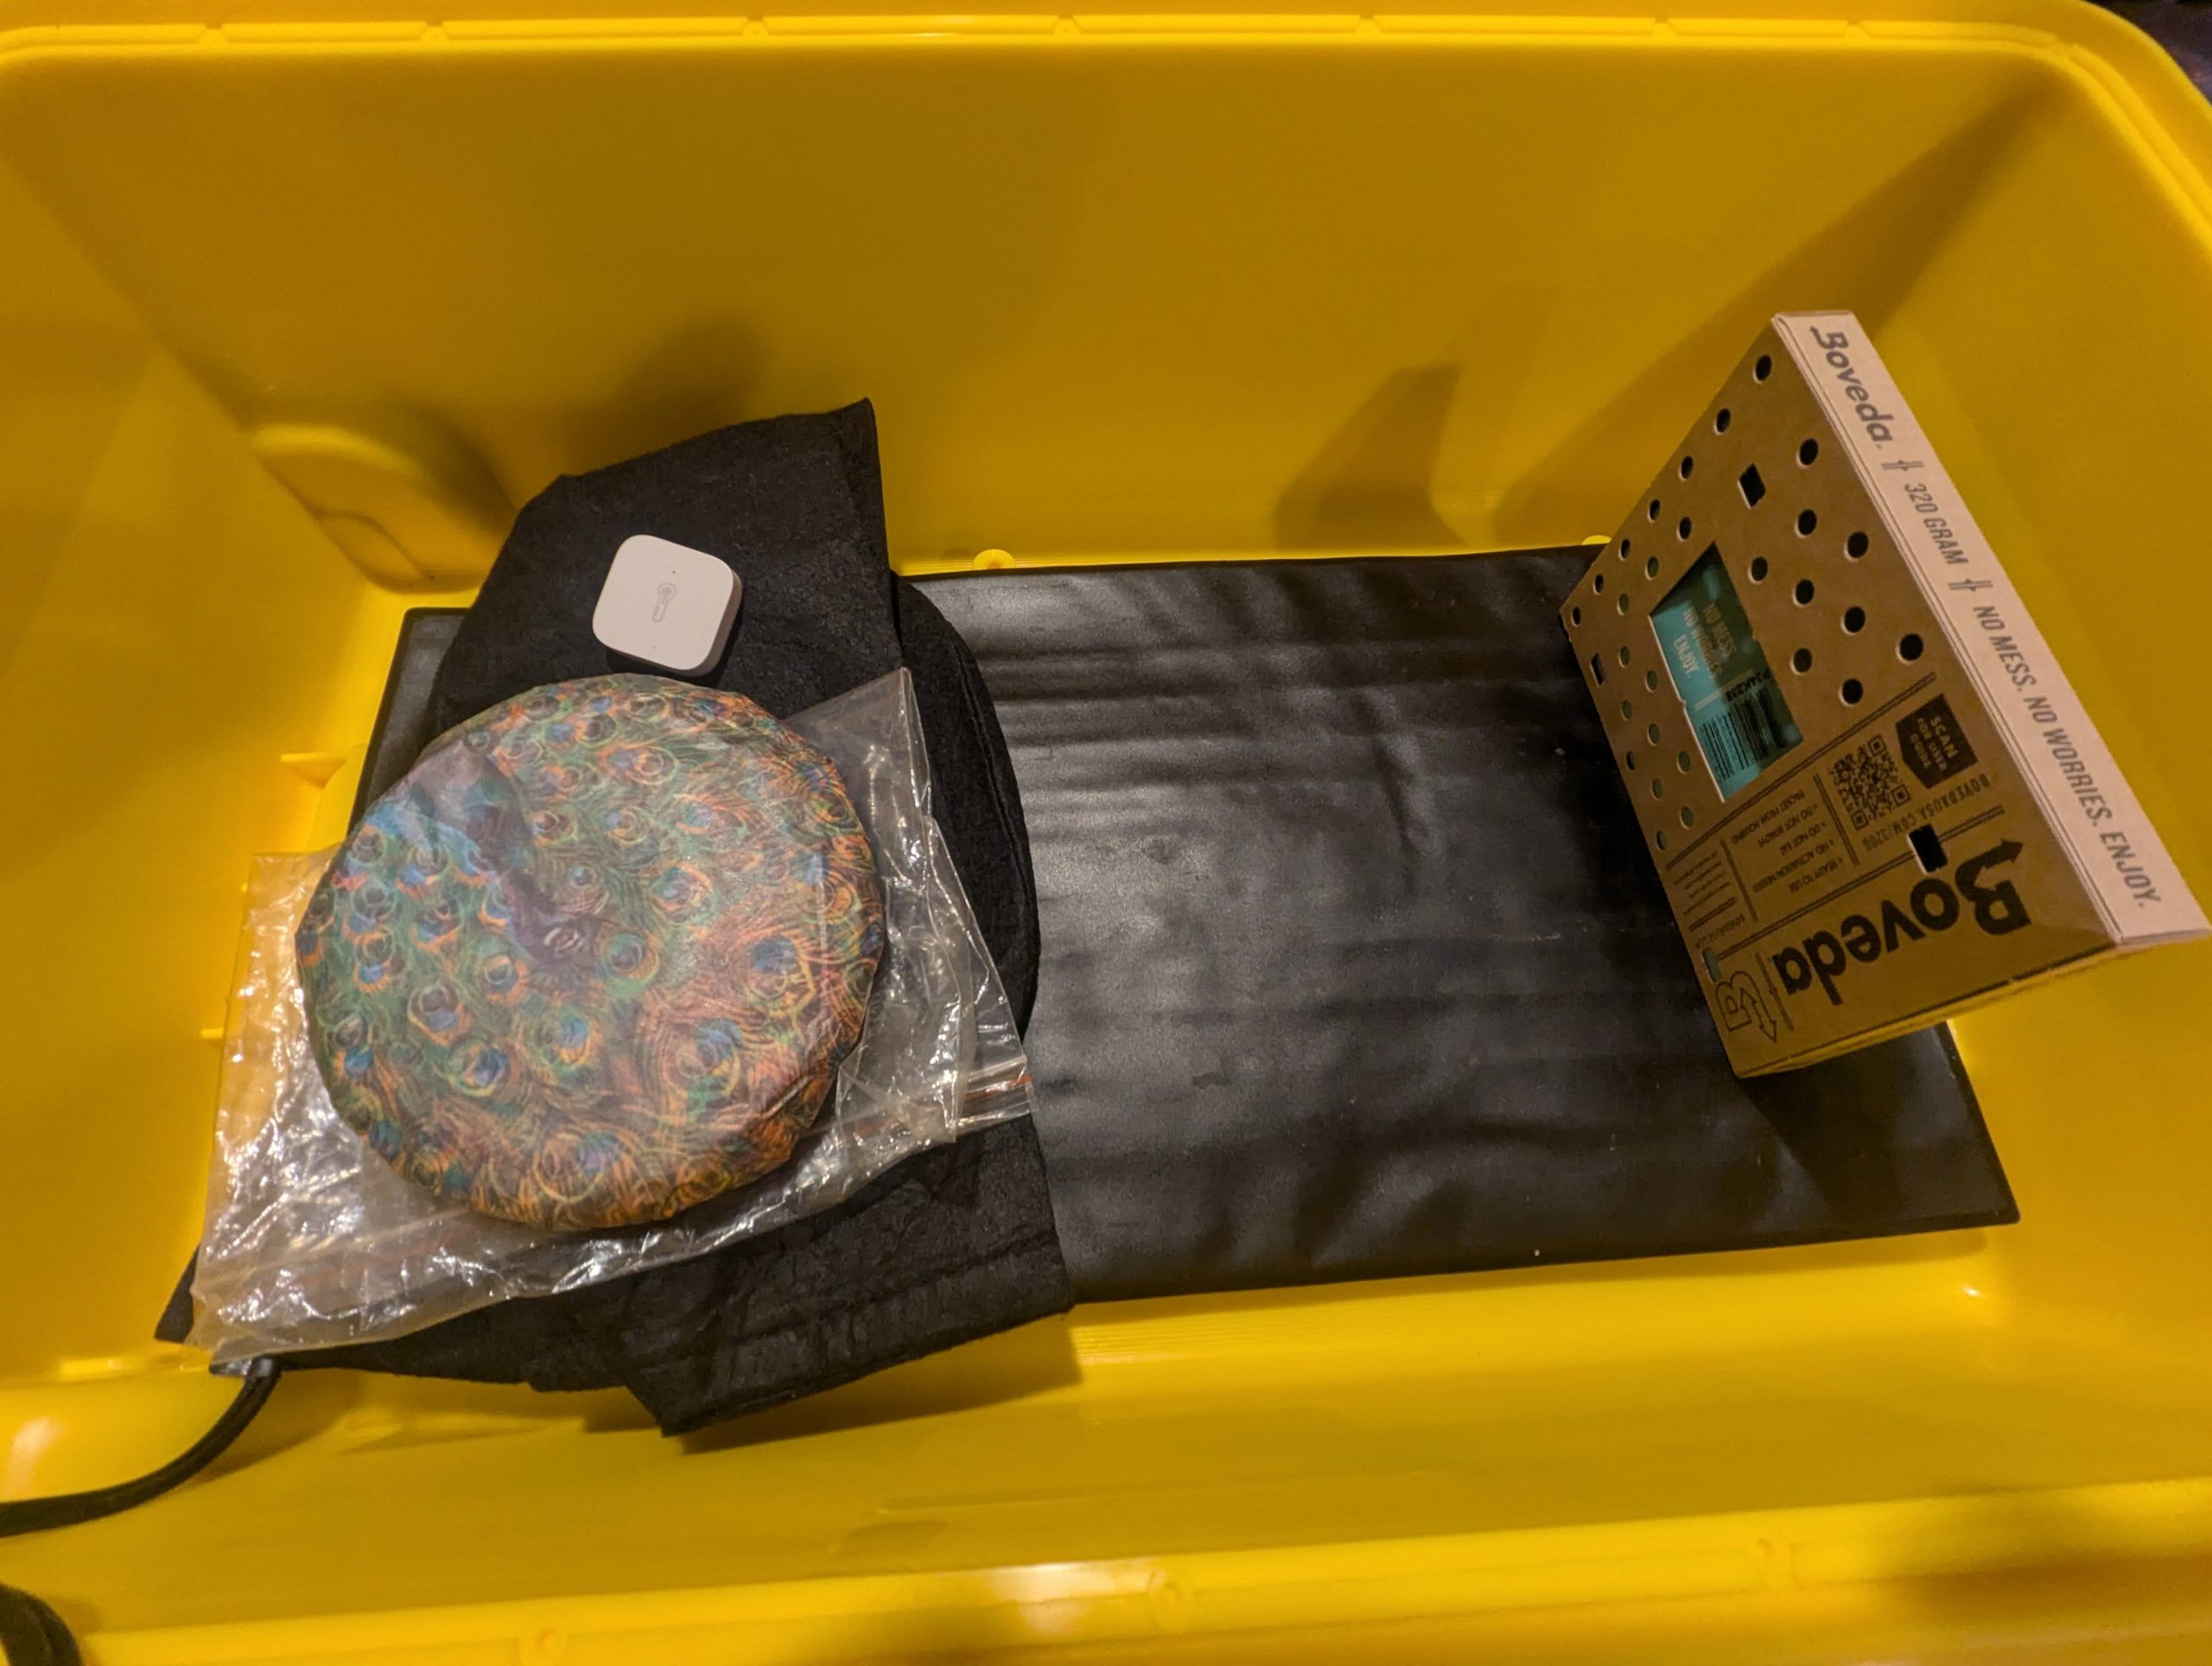
Gotta build my own I guess.
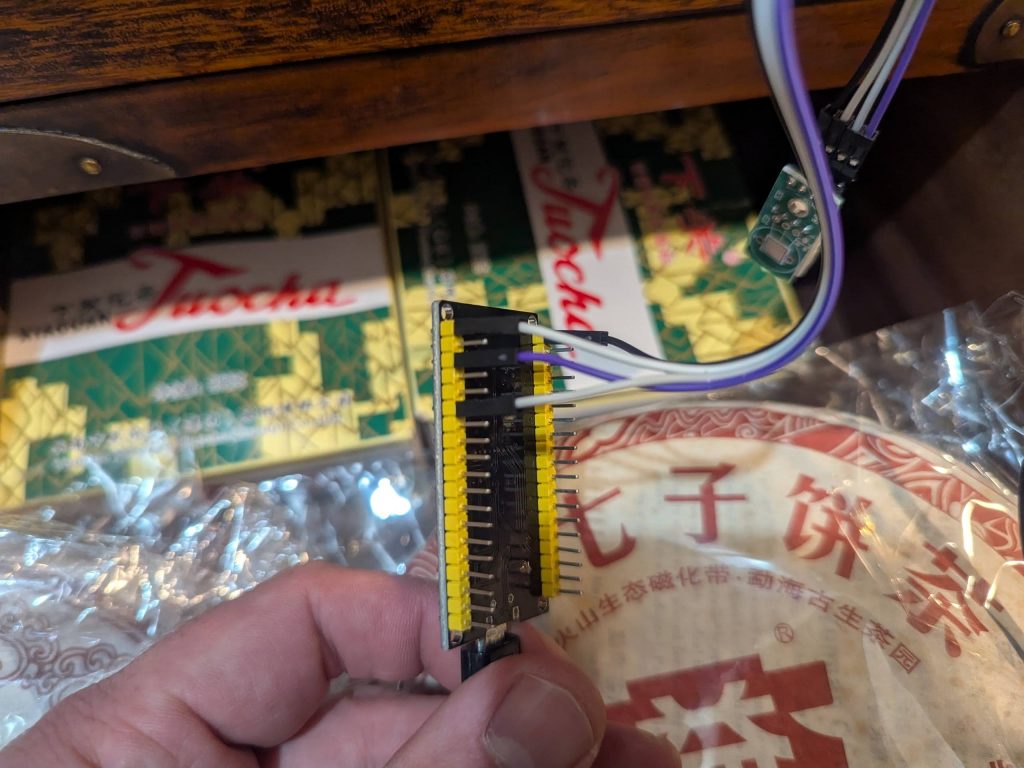
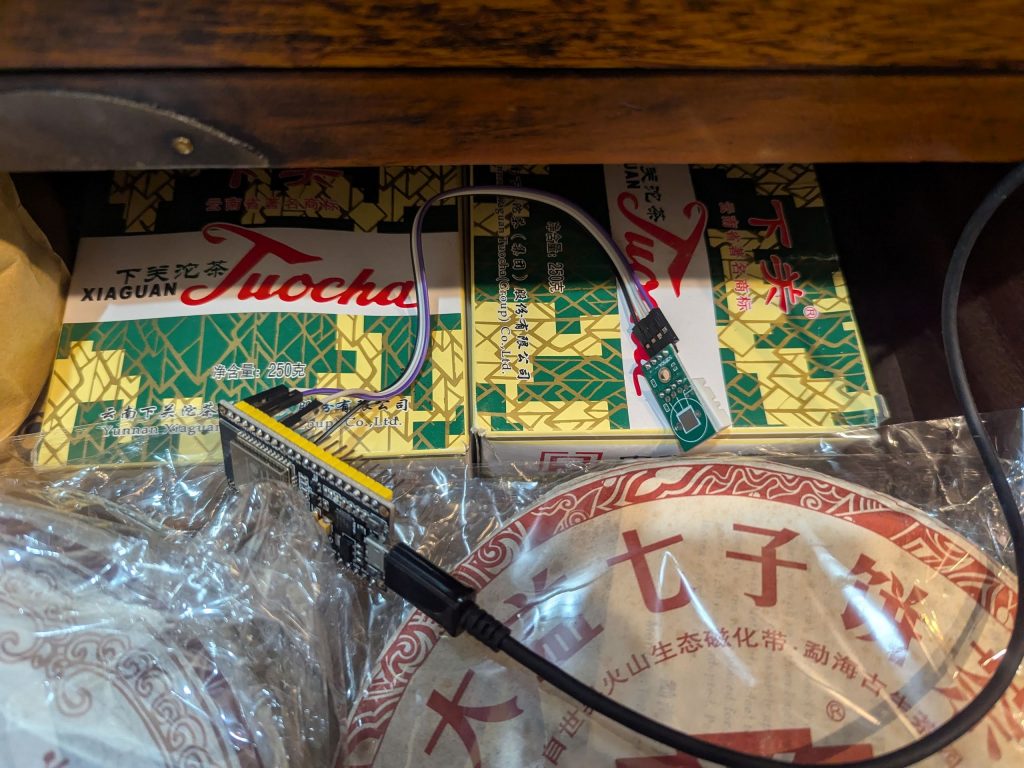
Version 2: ESP32 + SHTC3
I’m using a ESP32 board (NodeMCU 38 pinout) and a SHTC3 humidity and temperature sensor. Way way better.
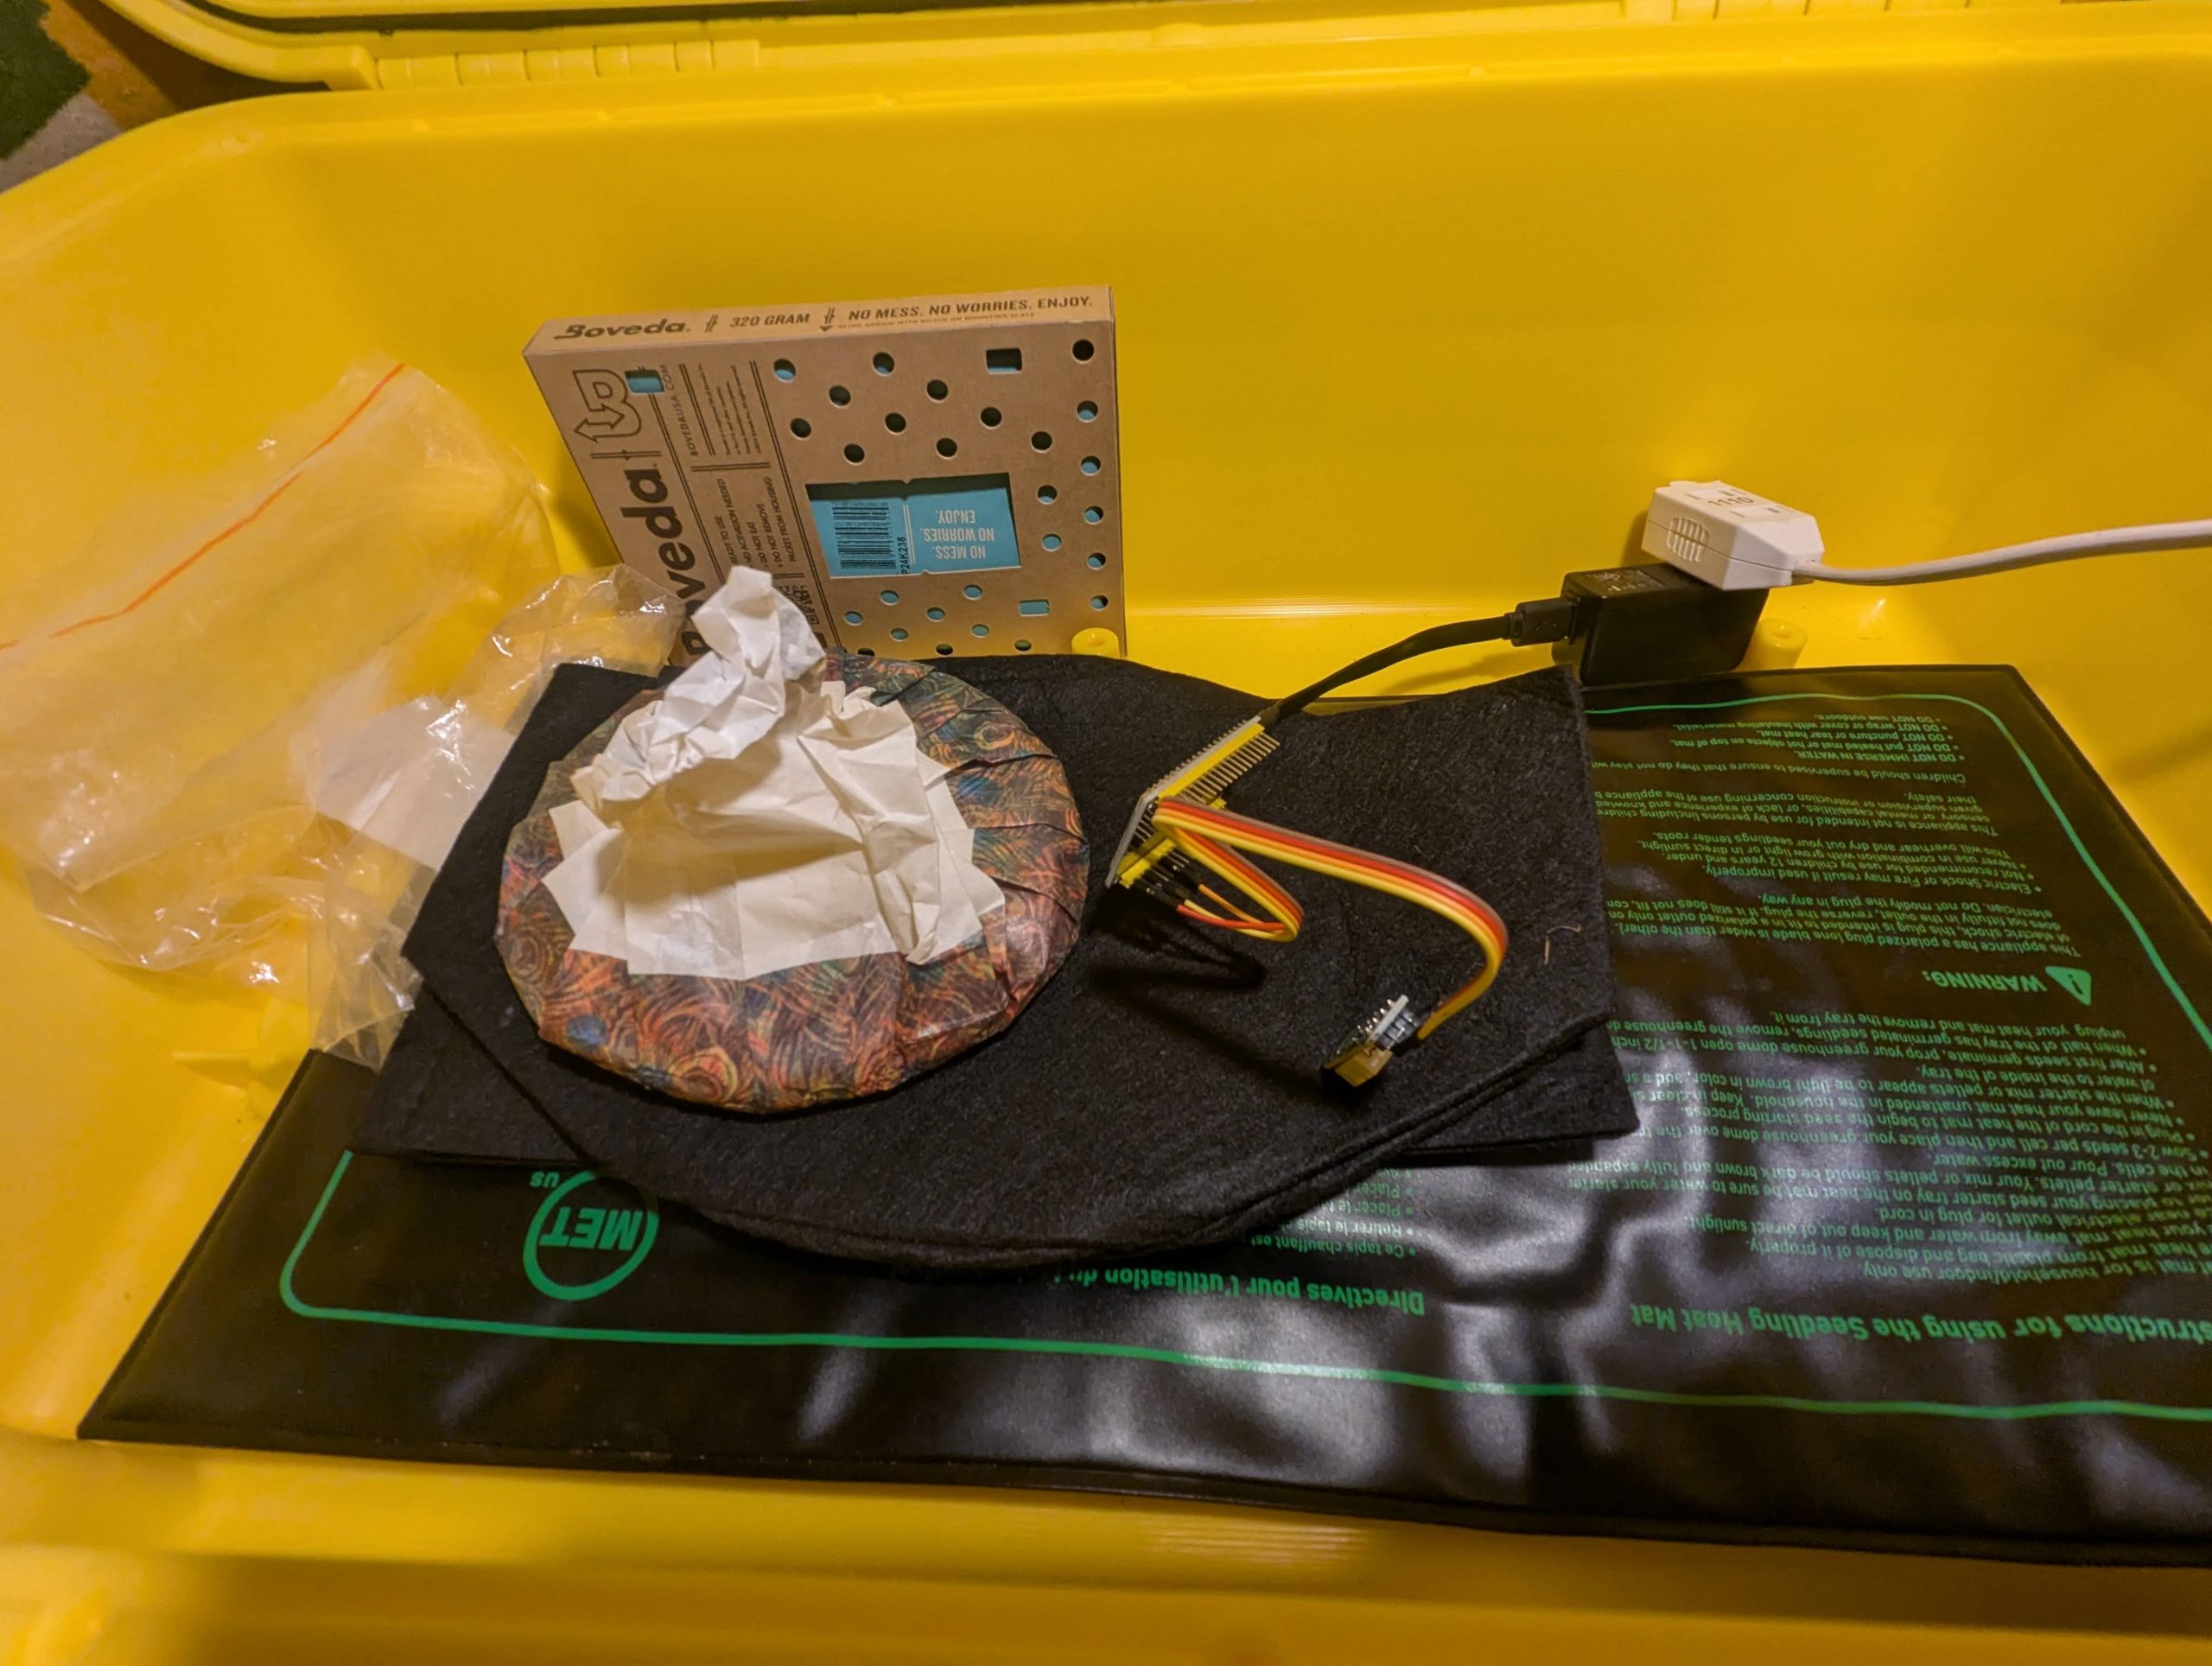
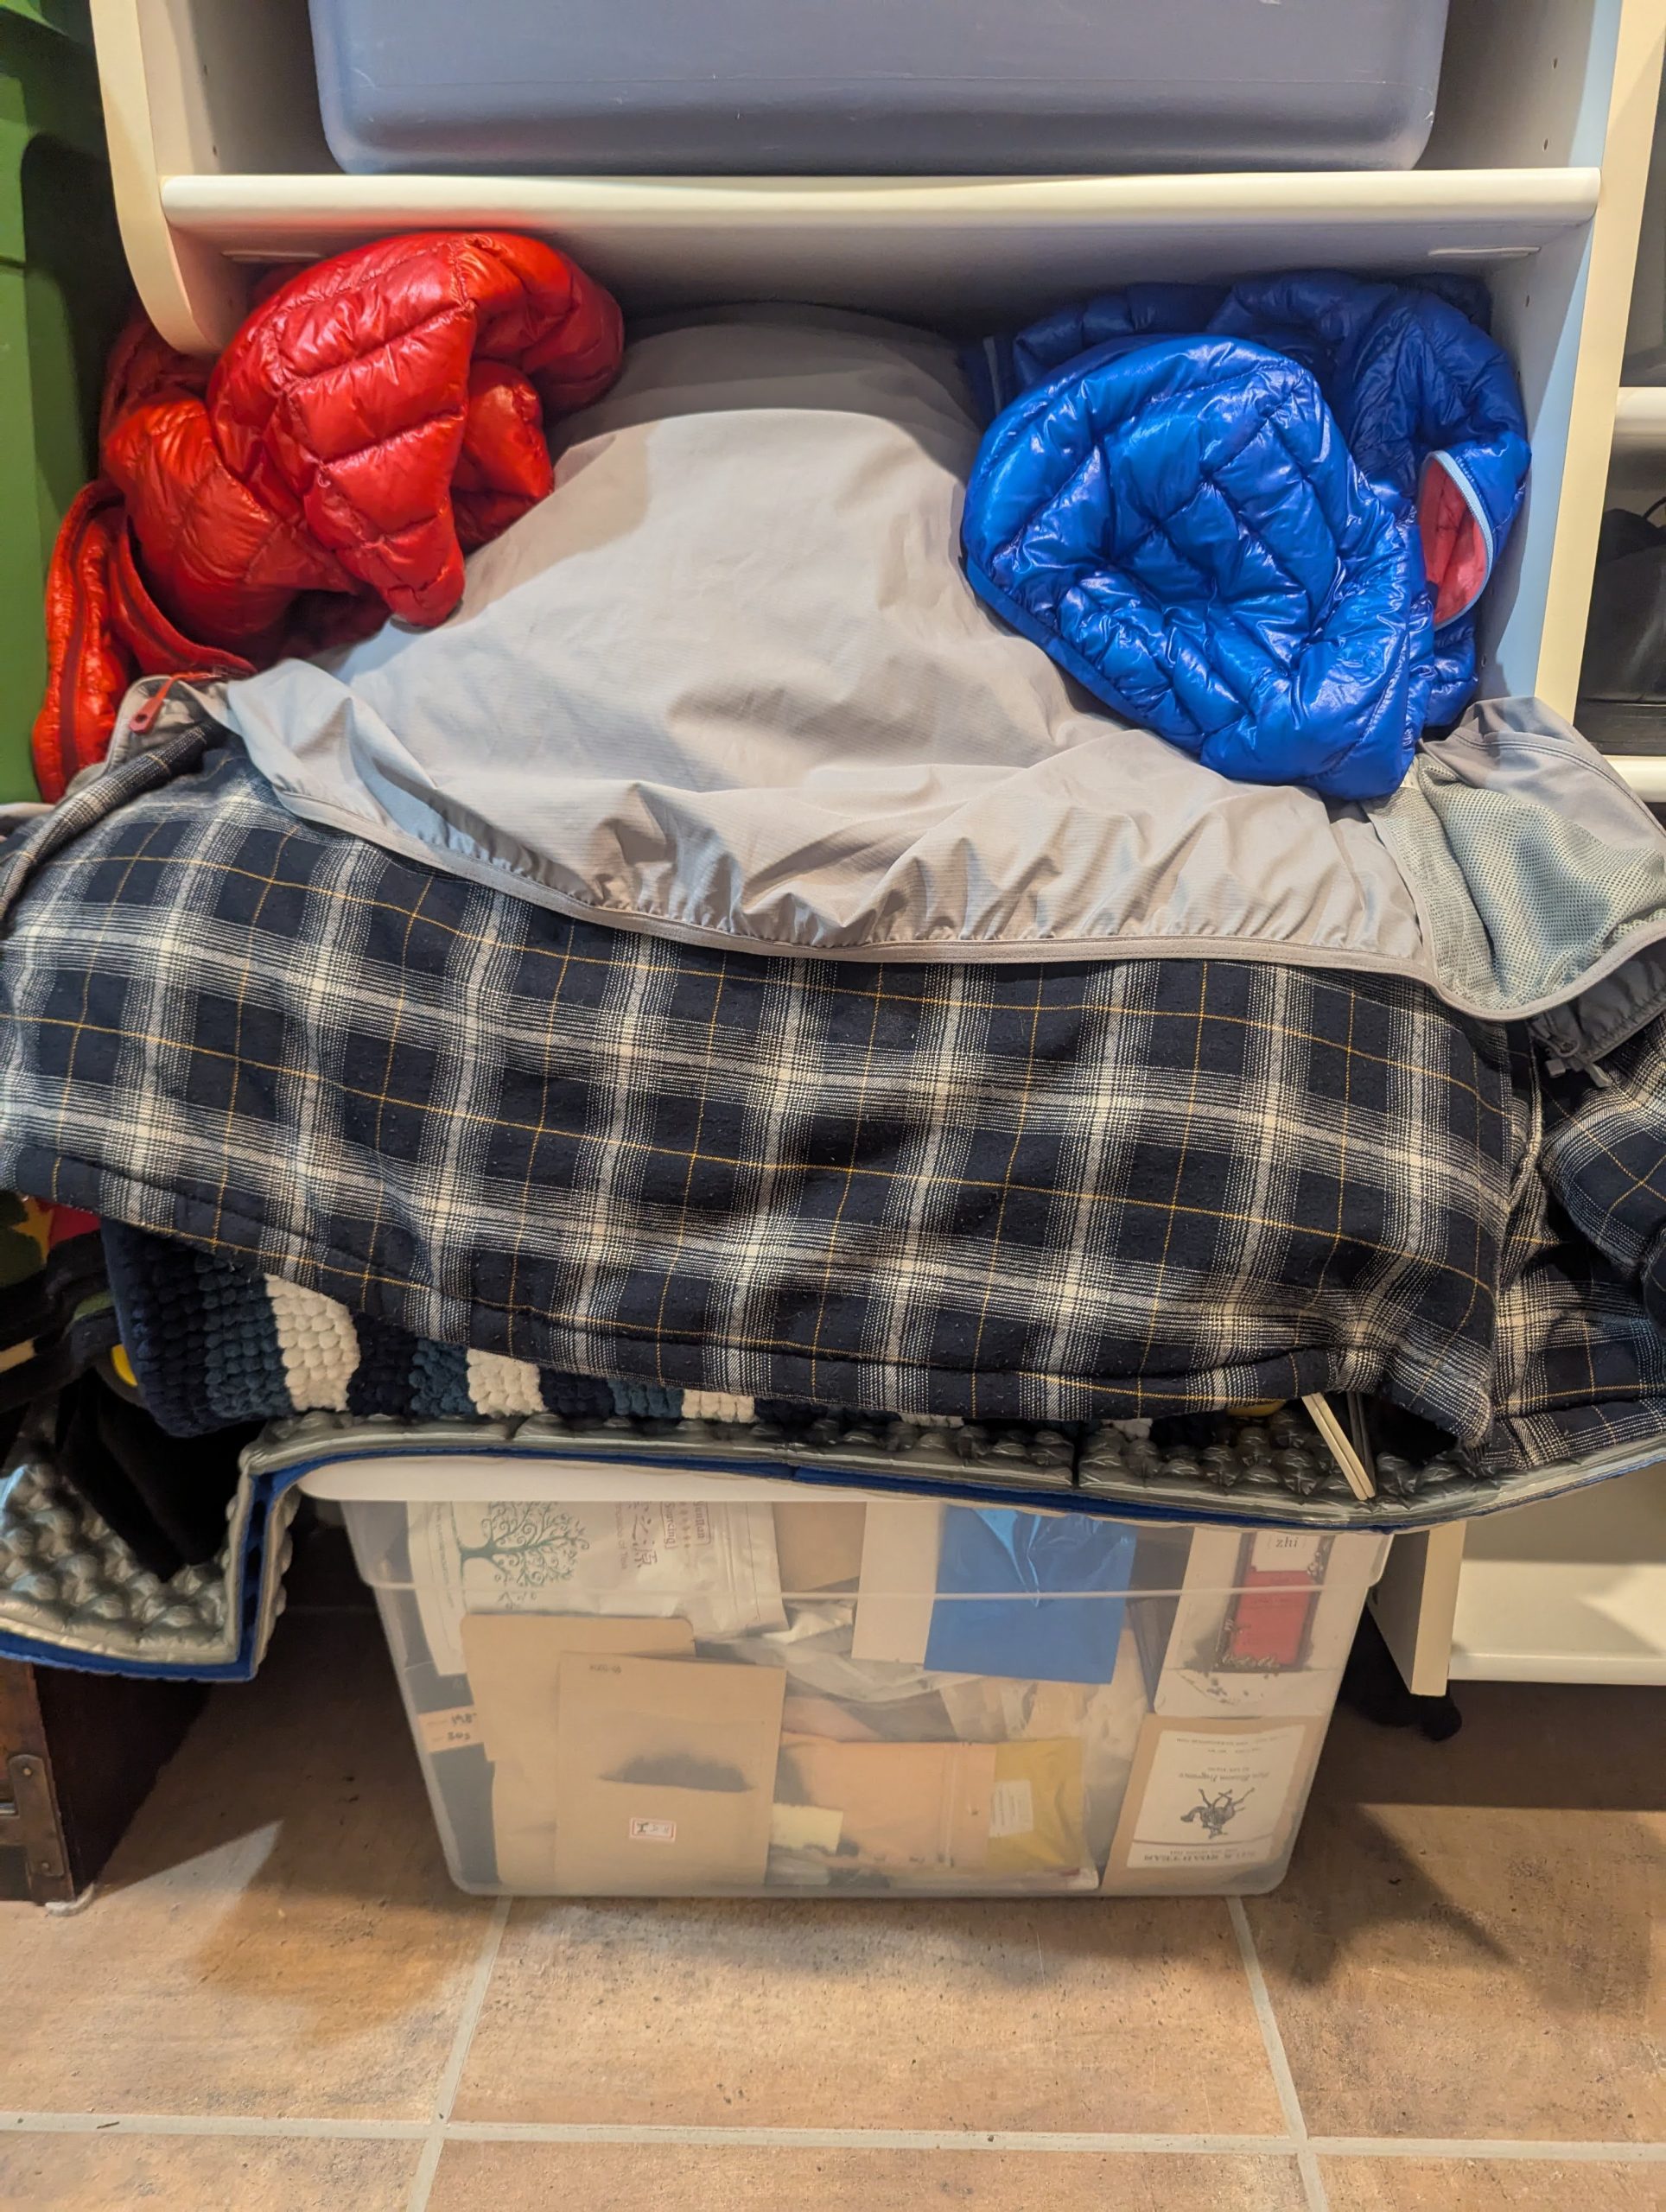
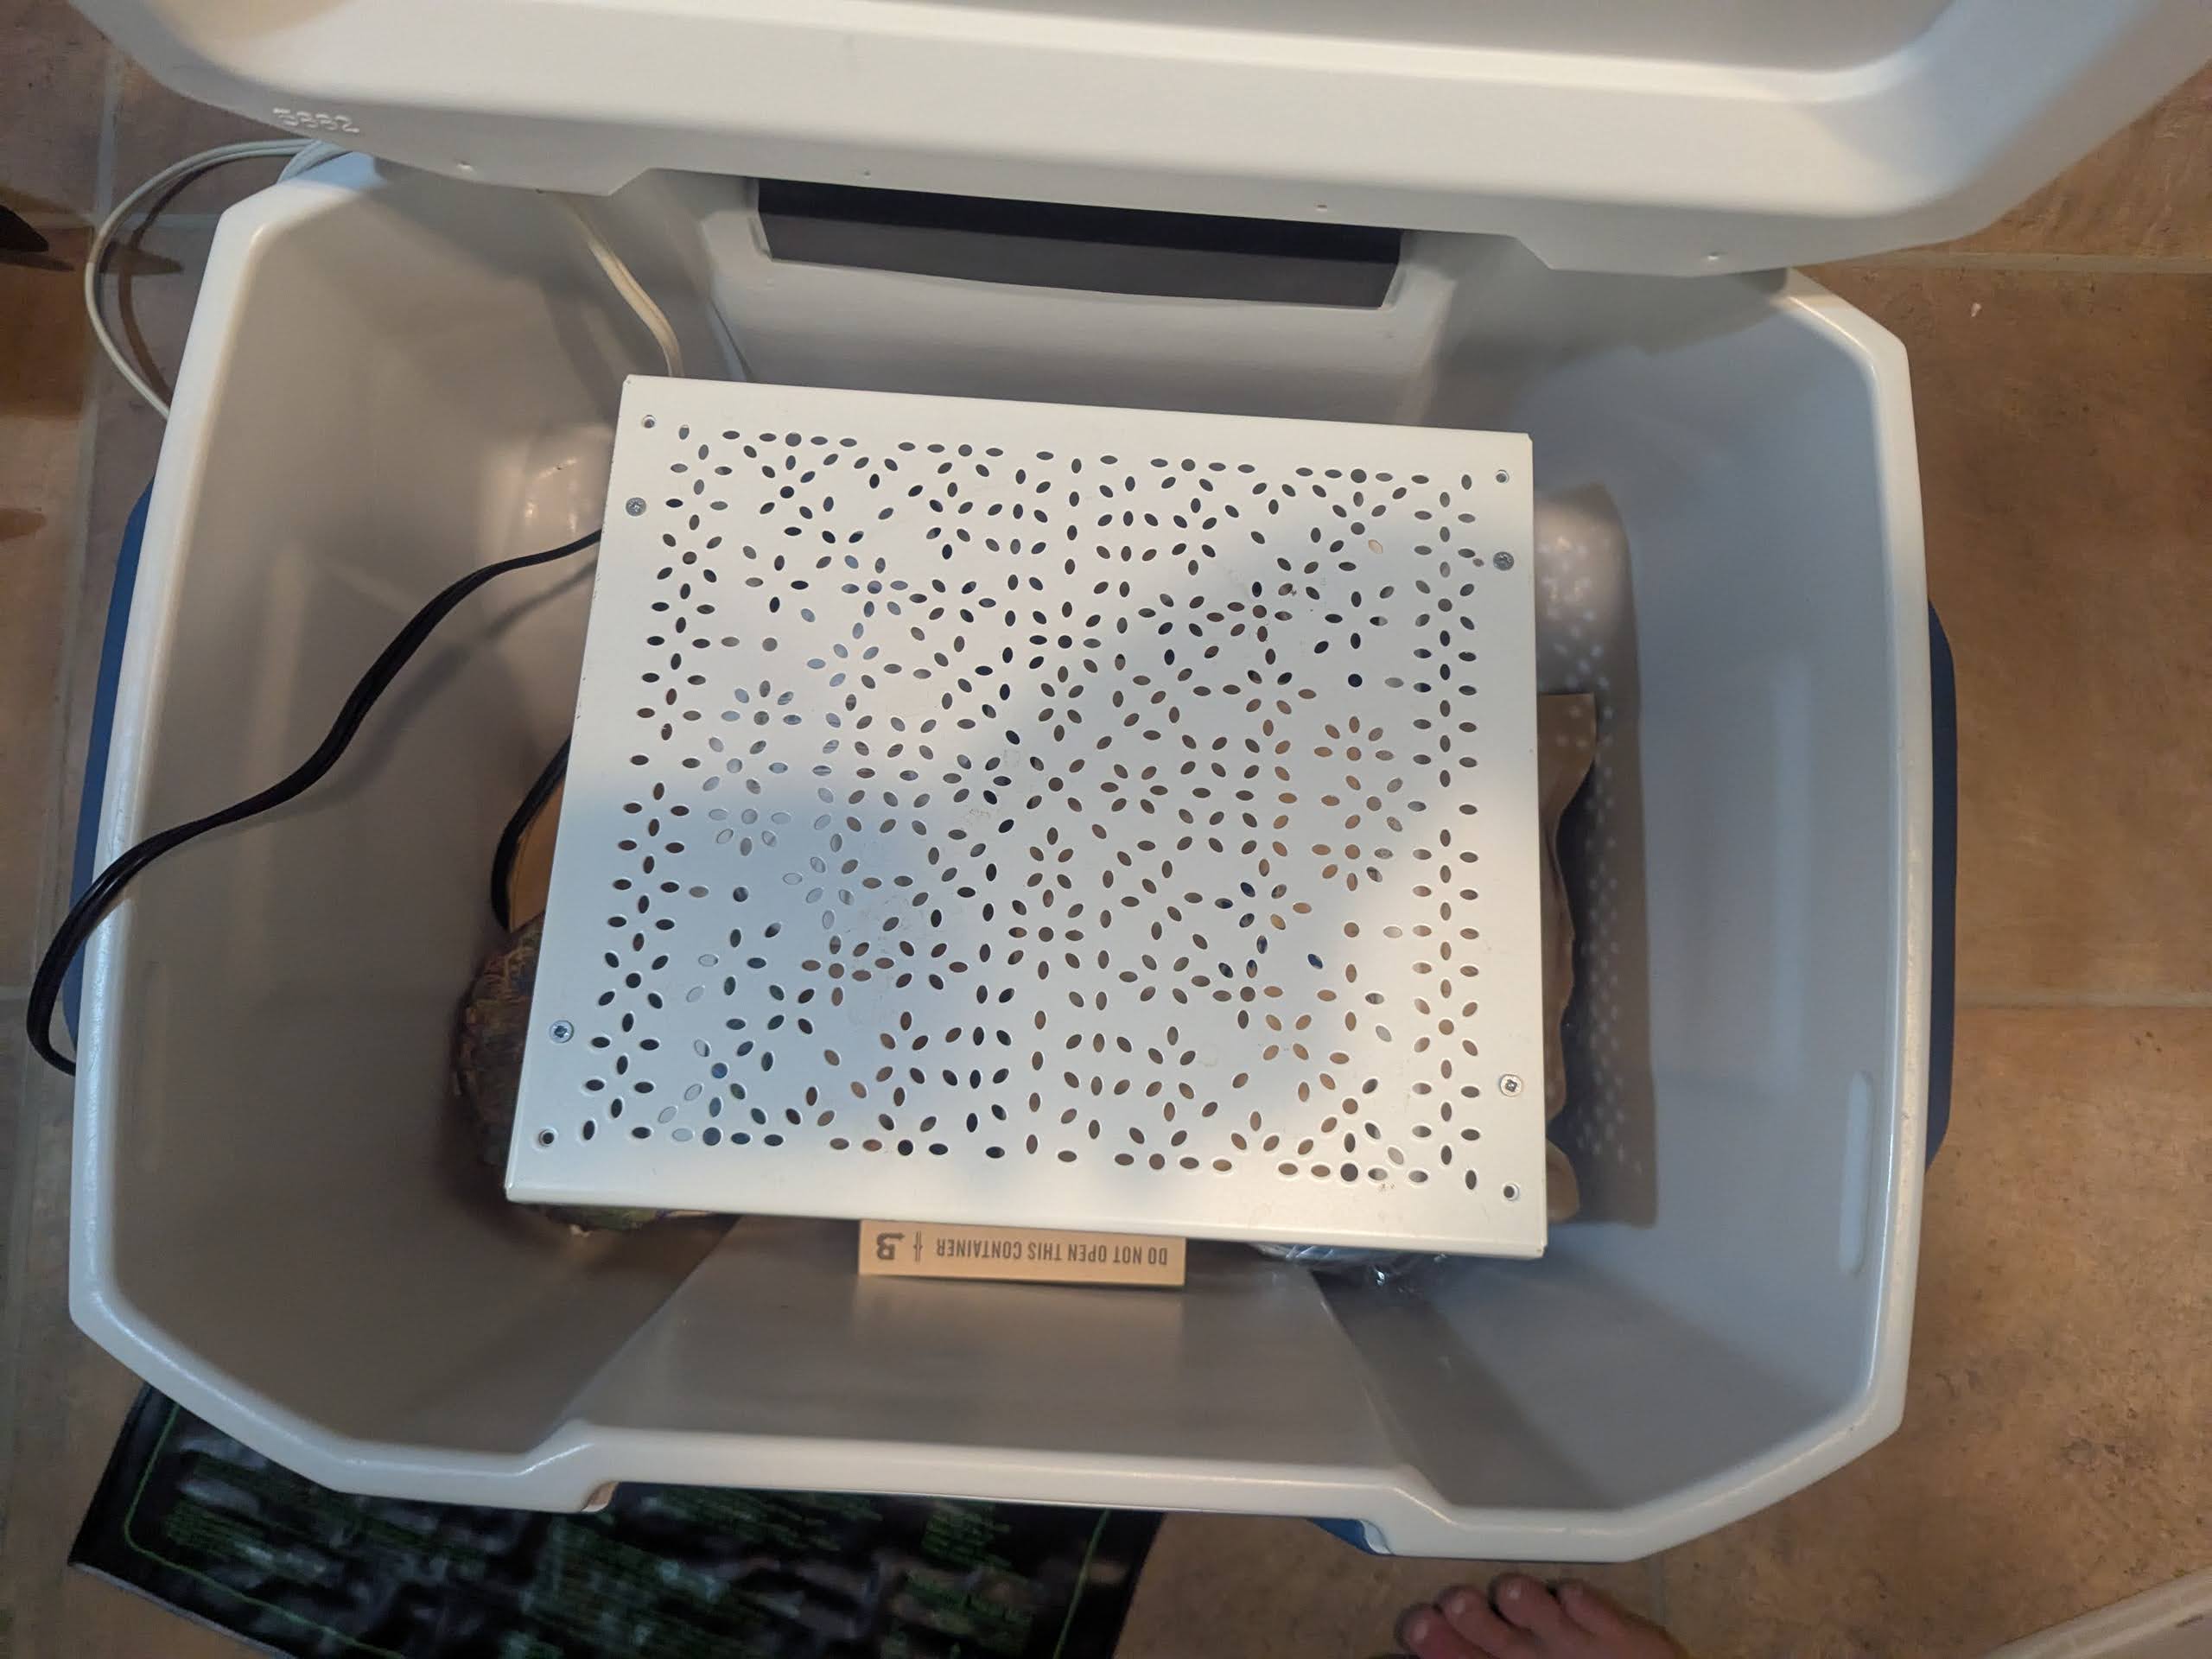
Wrap it up in blankets (insulation):
ESPHome Code
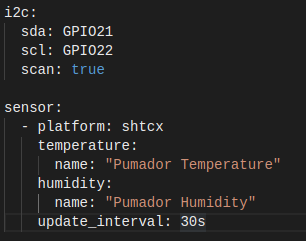 Here is the added logic beyond a standard ESPHome template for an ESP32 device, in case you want to build your own:
- i2c:
- sda: GPIO21
- scl: GPIO22
- scan: true
- sensor:
- – platform: shtcx
- temperature:
- name: “Pumidor Temperature”
- humidity:
- update_interval: 30s
While it does require a wired power source (I mean I could run this off a portable battery but w/e), this device is way way way more accurate.
I also moved my pumidor into the room adjacent to our furnace to reduce the burden on the heating pad and save a bit of money. The concern in this room is the ambient humidity is extremely low, but so far so good!
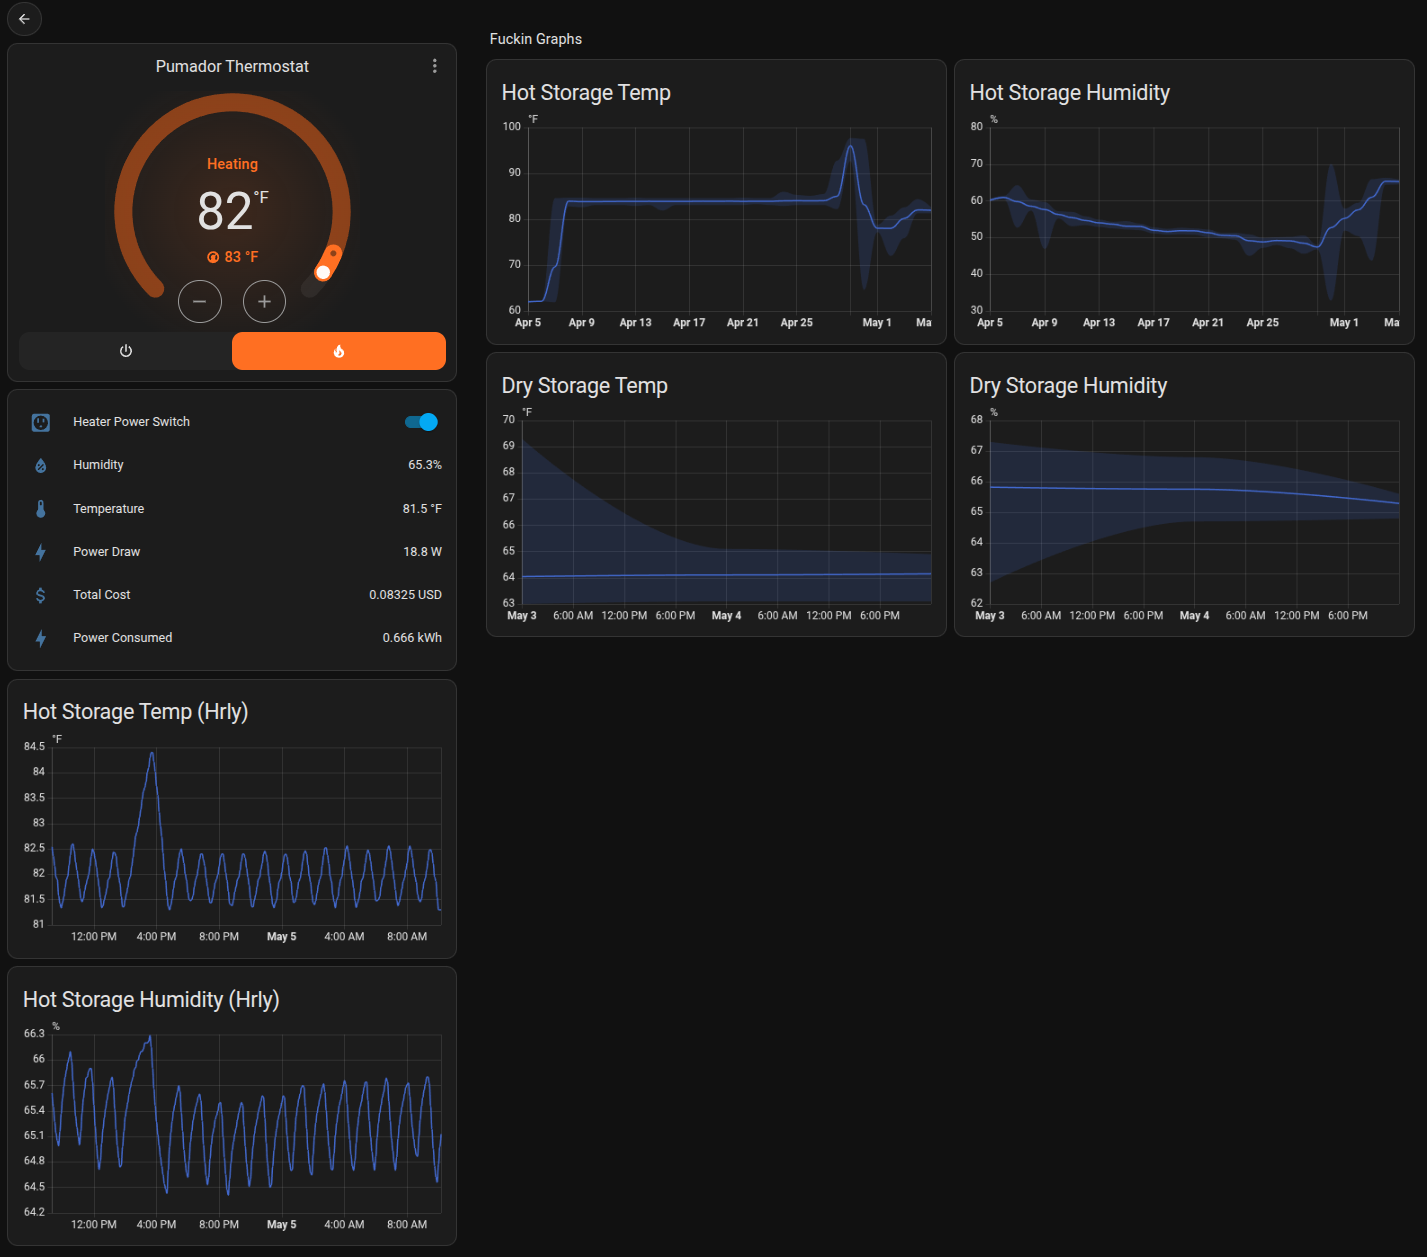
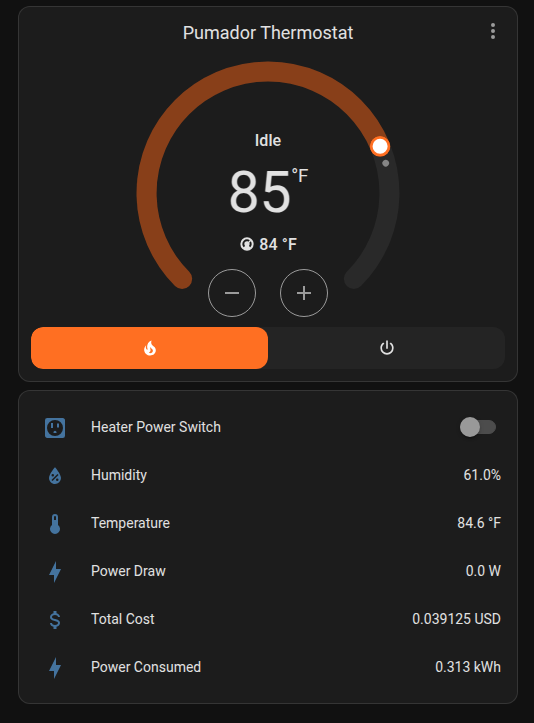
Here’s how it looks inside my HomeAssistant UI:
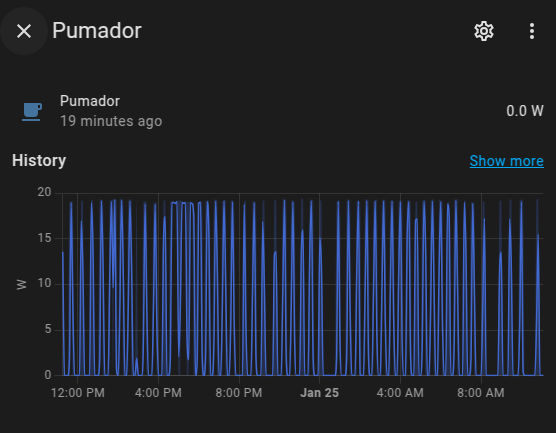
Wattage reading, effectively its power cycle visualized:
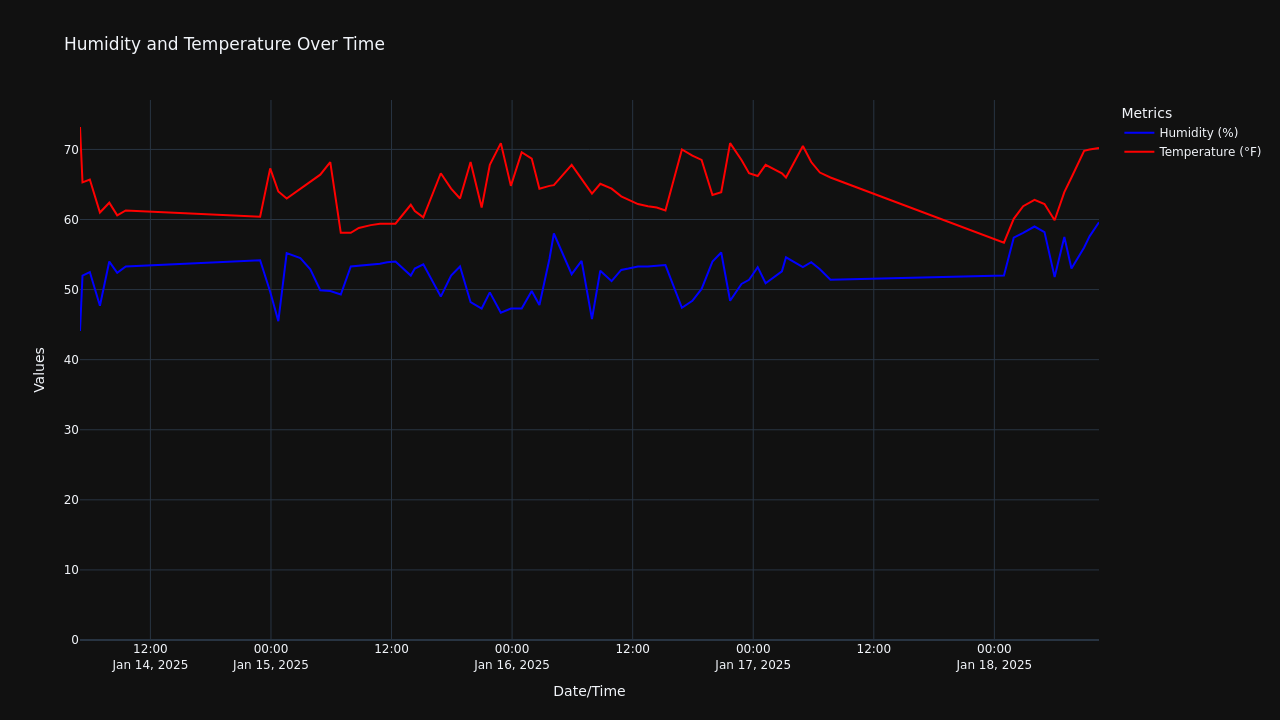
Generating Data
Humidity and temperature updates every hour directly from my pumedor to the interactive graph below.
Full Screen Interactive Graph Link: https://teadb.org/humidity_temperature_graph.html
Publish It Online
Naturally I had to figure out a way to get it online. I’m using HomeAssistant’s API, pulling data to a spreadsheet file via an hourly cron job, which I then run some simple python on to generate the above graph. My script also takes a screenshot and updates the featured image of this blog post hourly.
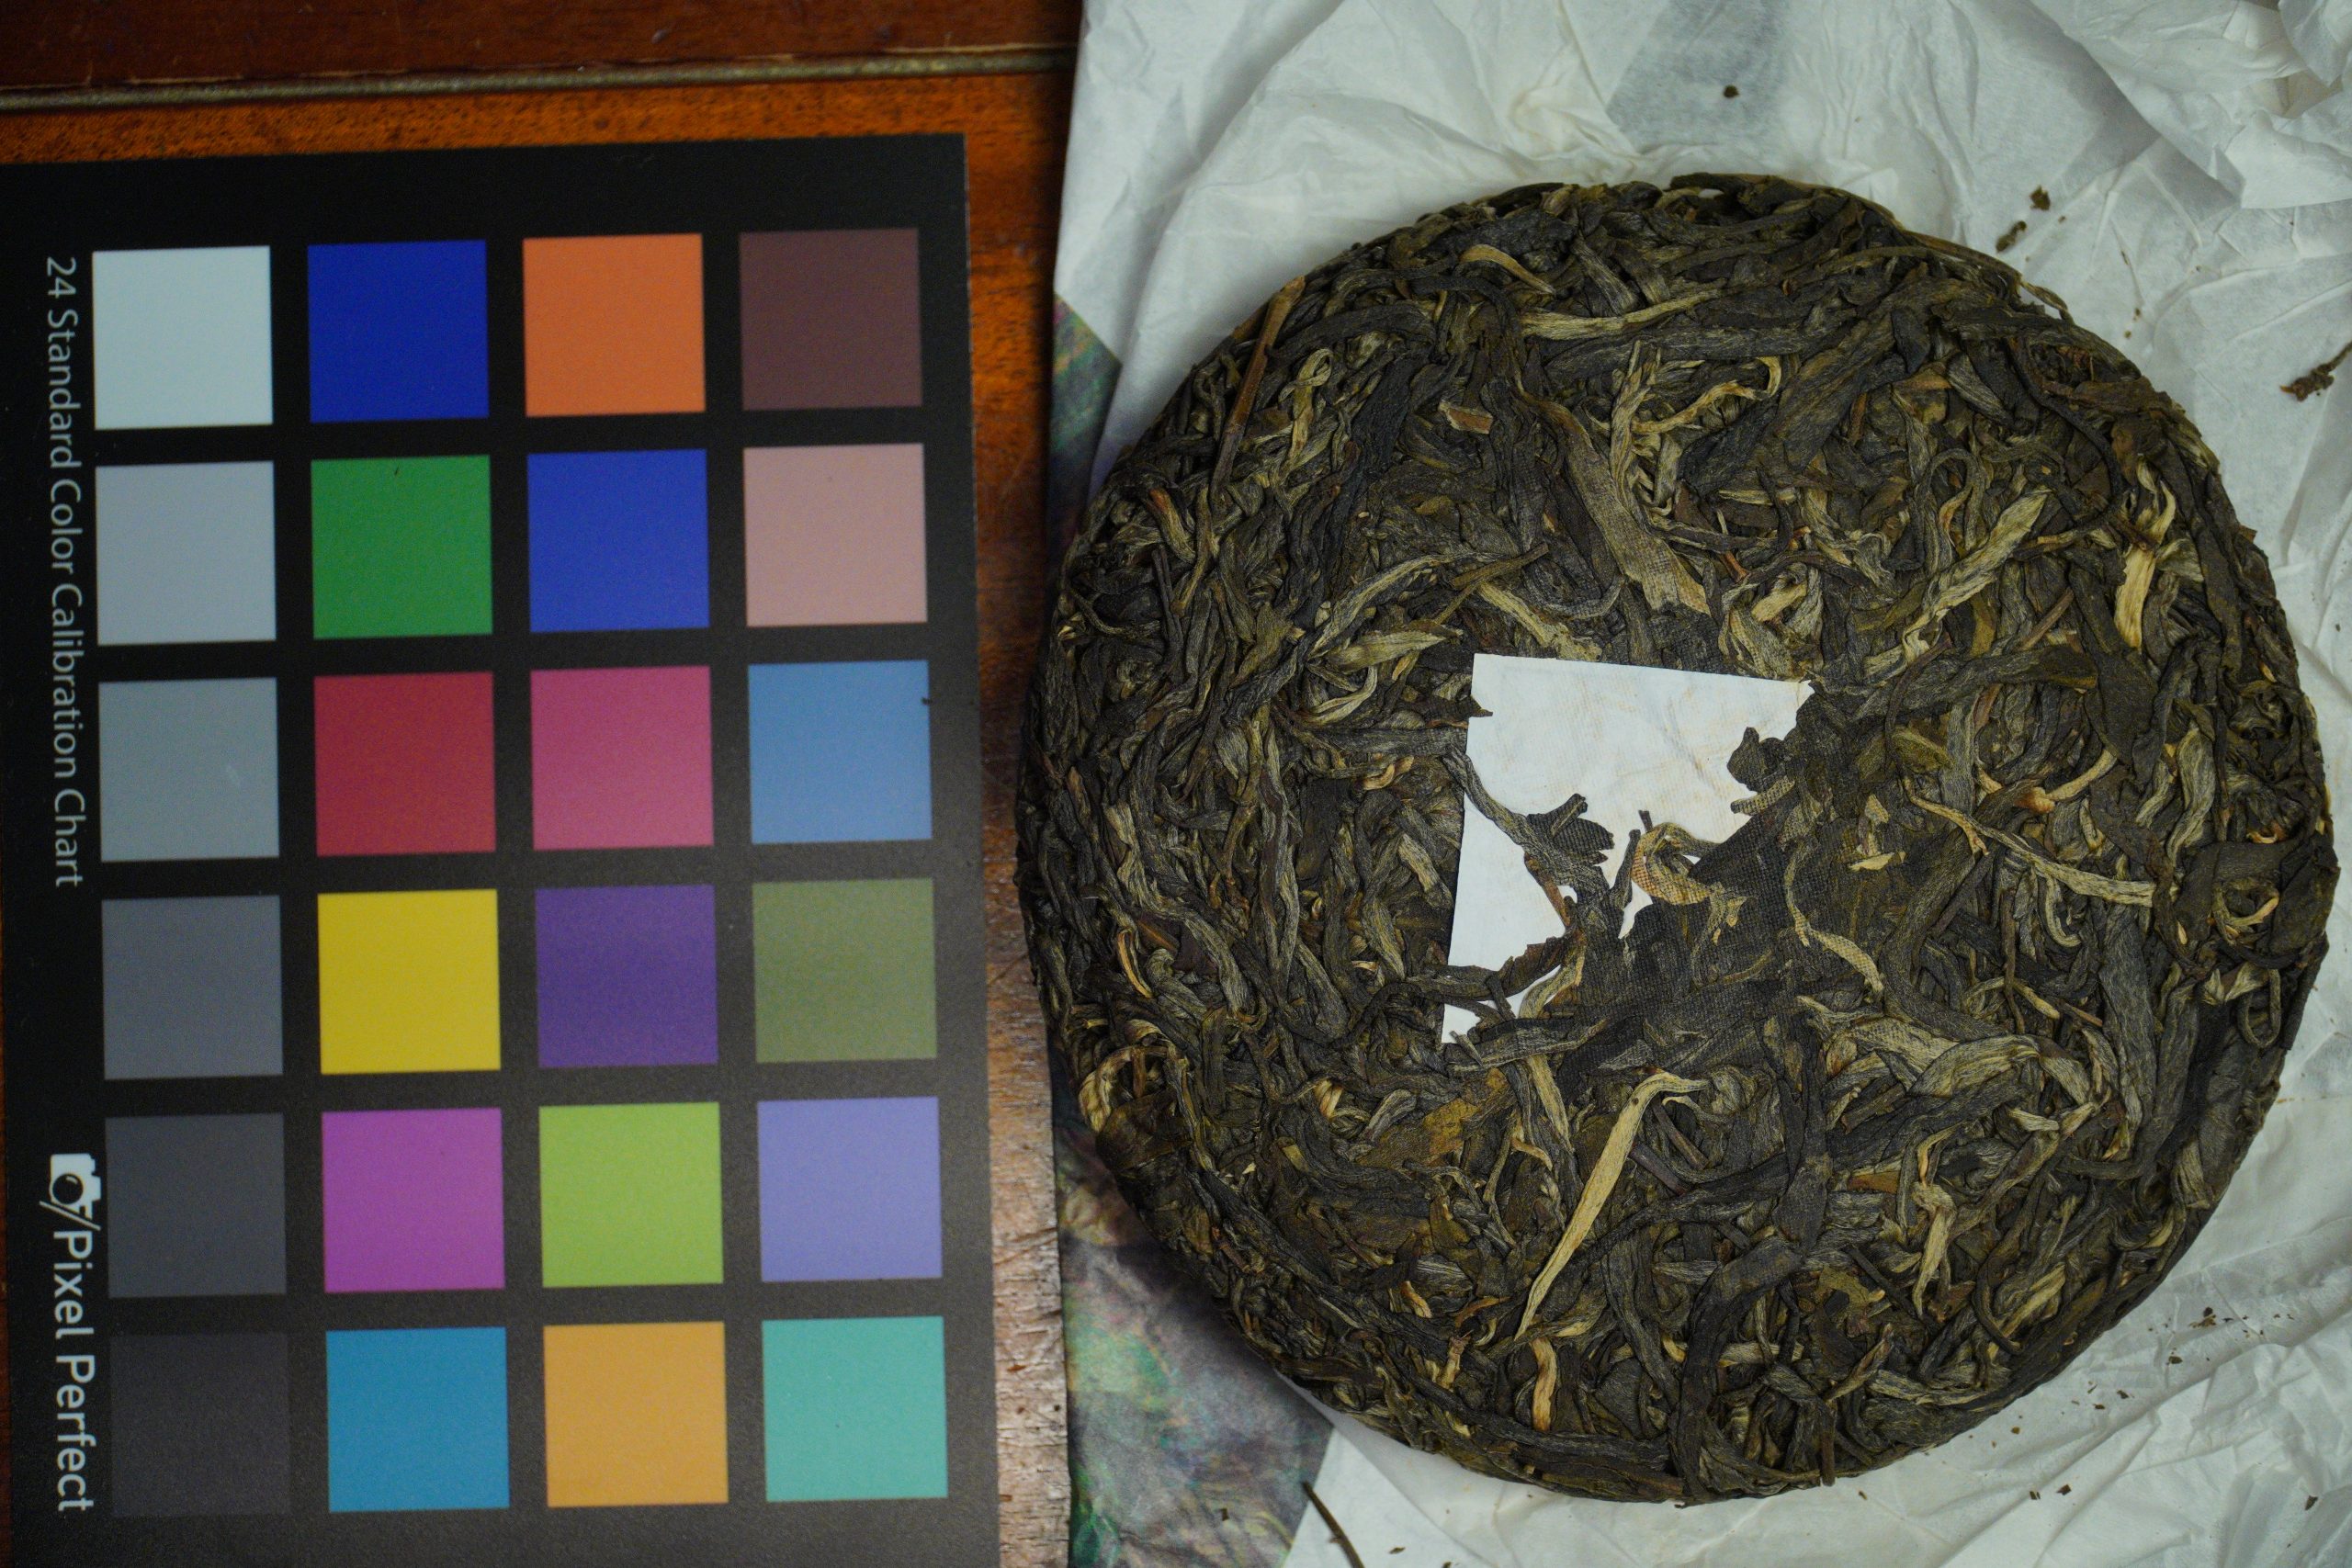
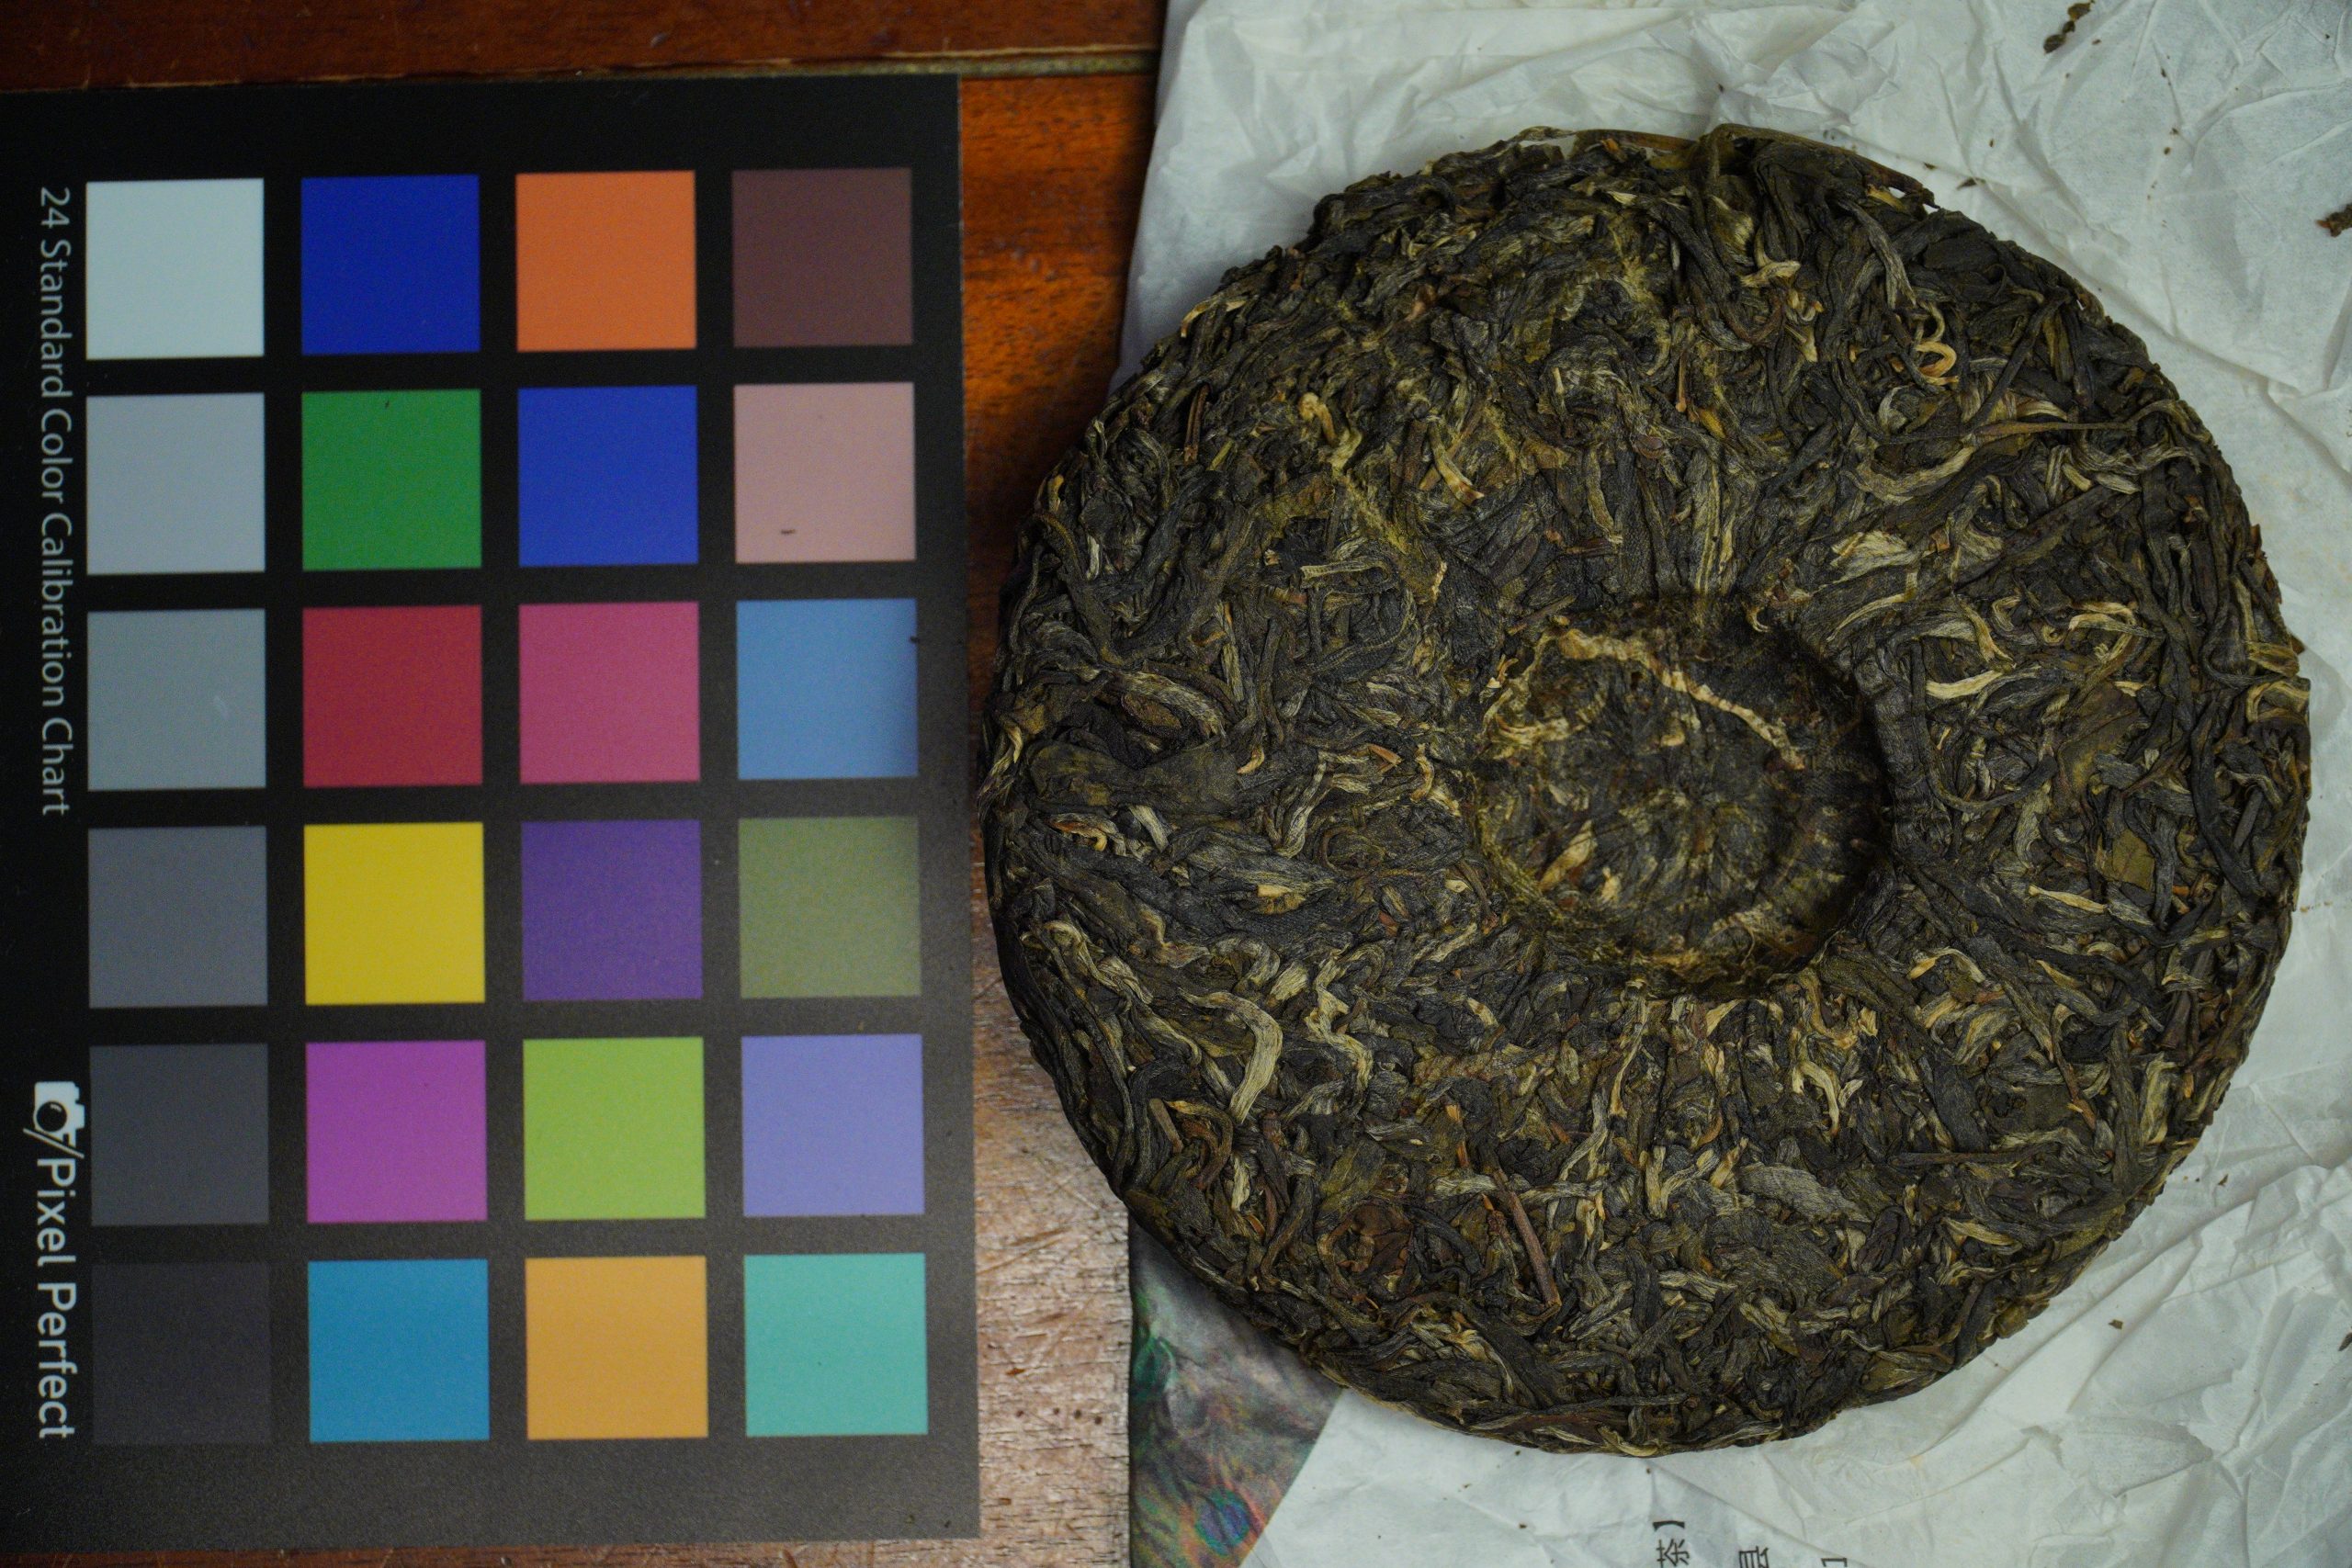
Taking Photos: Color Accuracy Over Time
Turns out, to do this right is hard.
My 80/20 TLDR:
- Taking photos at night
- Same lighting setup
- Take a lot of photos
- Color match photos across time
Materials & Tools
- RawTherapee
- Color Correction Card
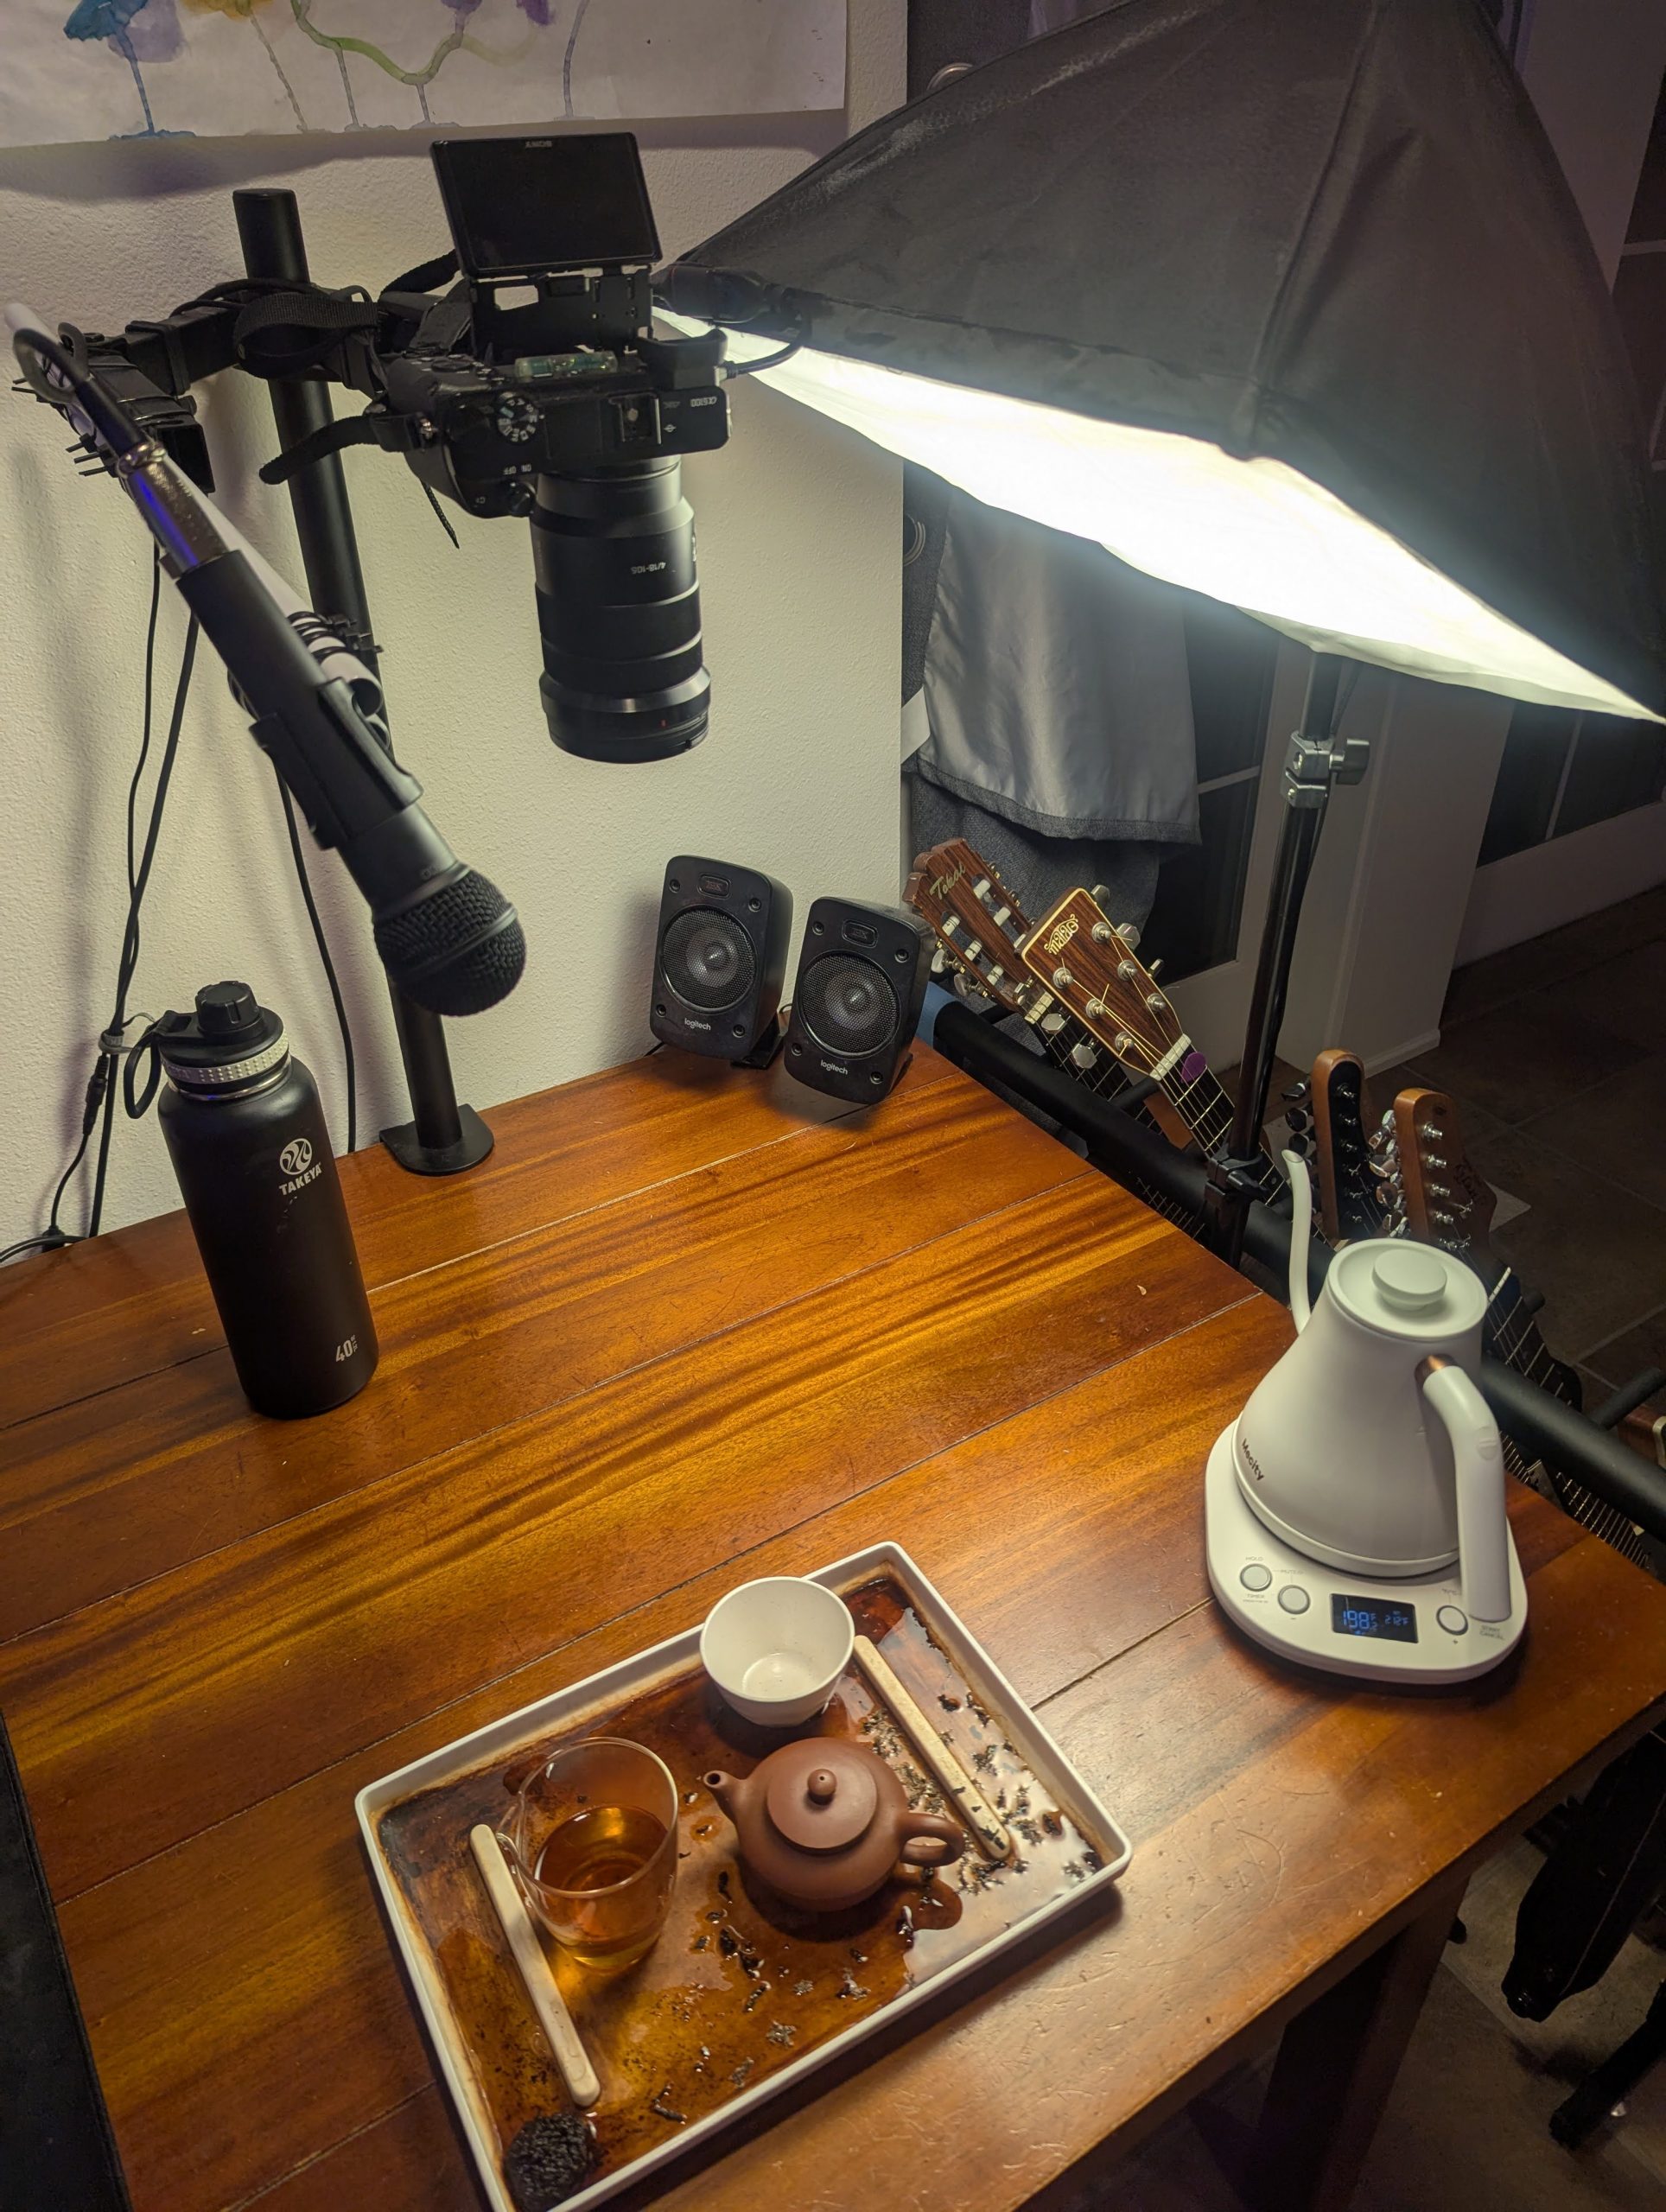
Lighting Setup
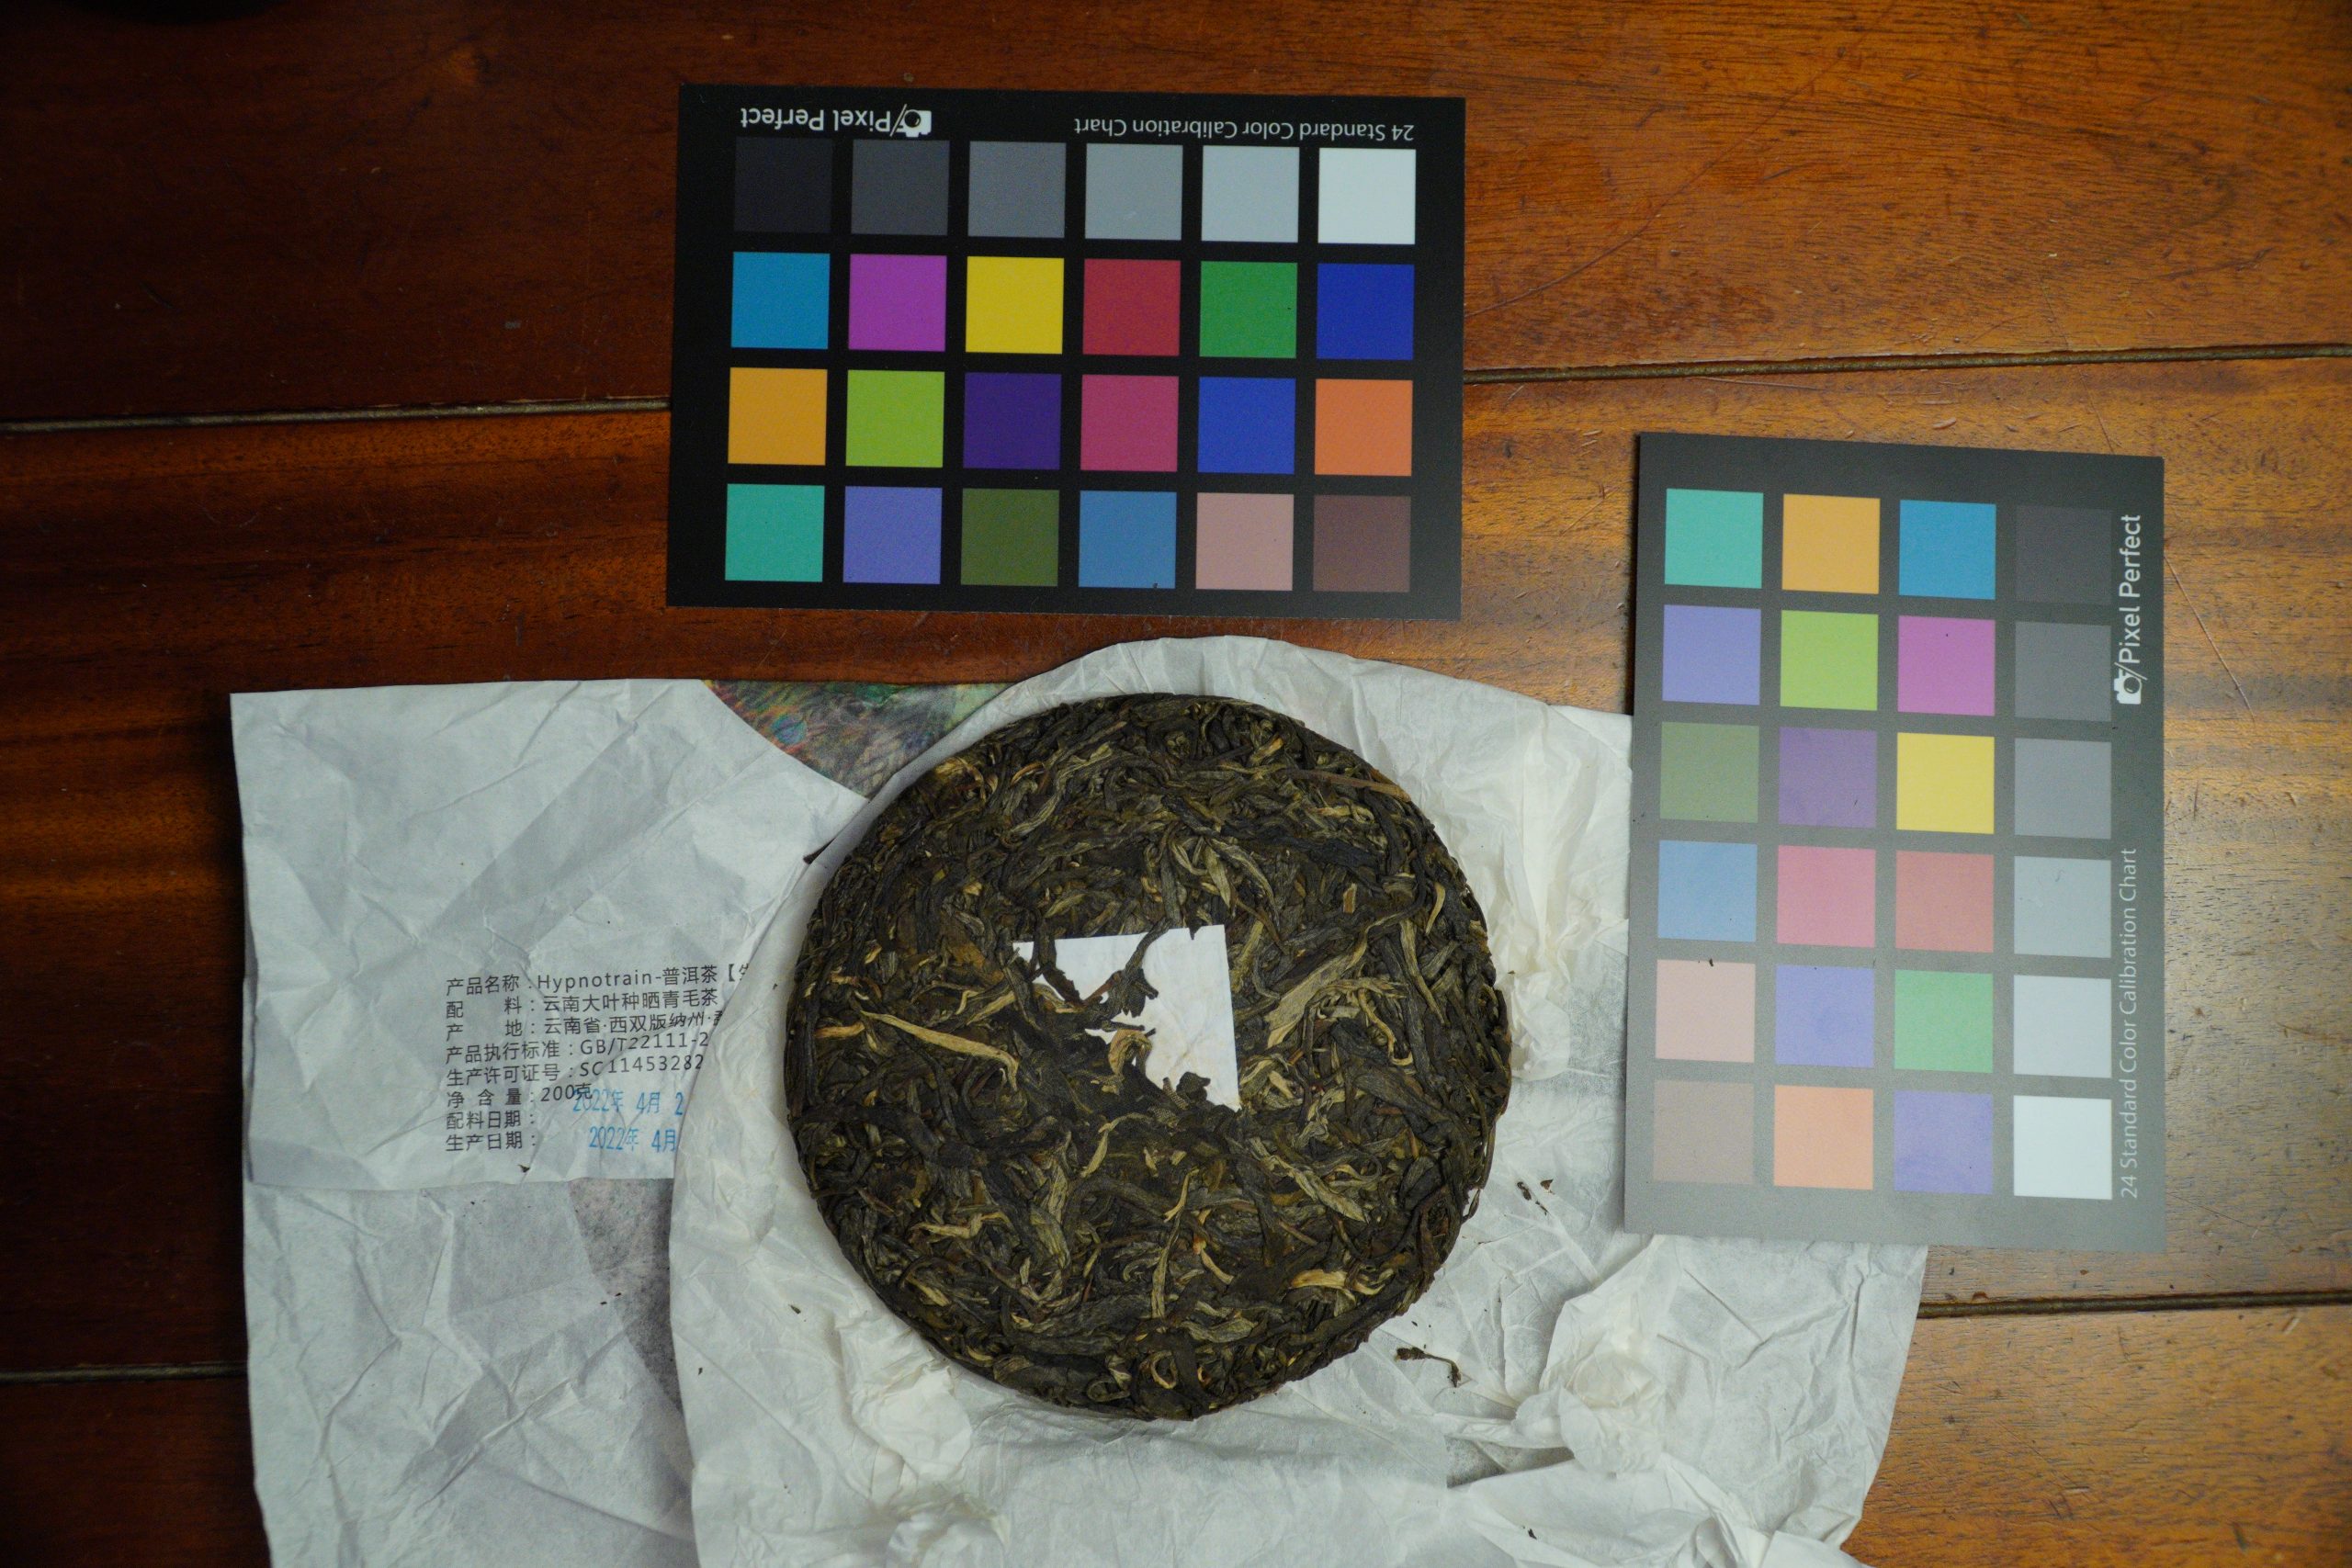
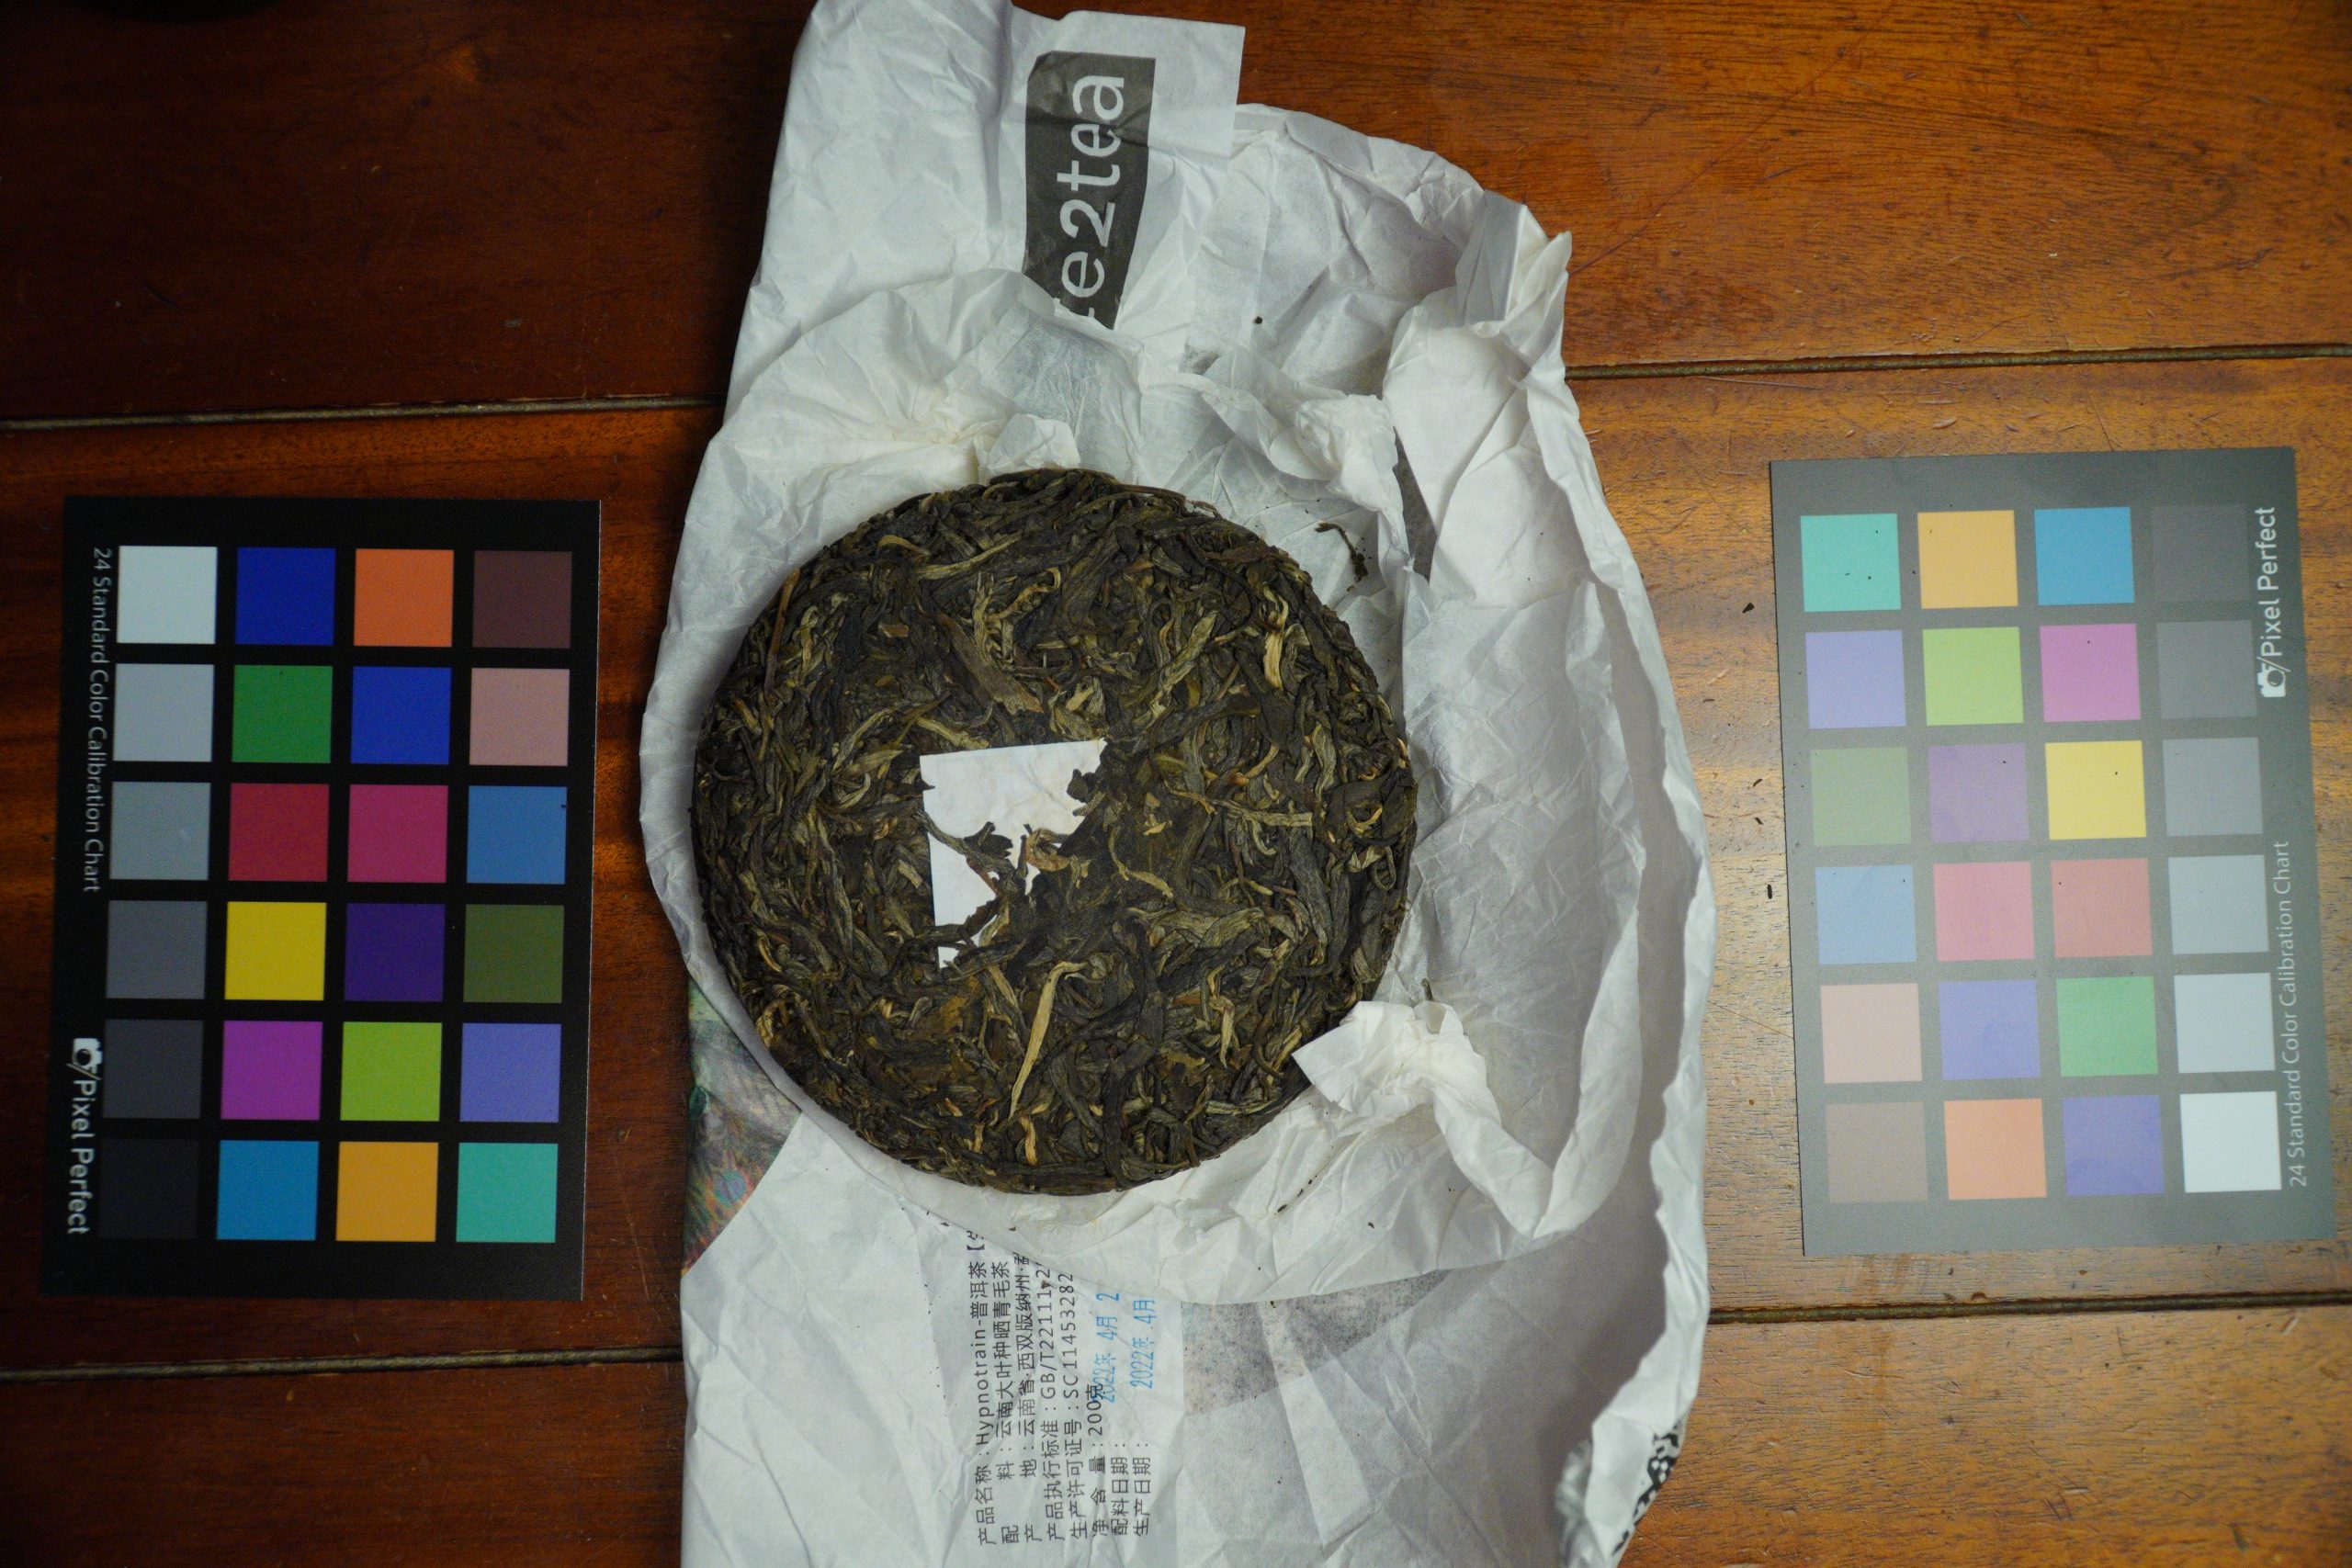
White2Tea Hypnotrain
TeaDB Episode #520: https://www.youtube.com/watch?v=HBFJ9Hy2Nho
URL: https://white2tea.com/products/2022-hypnotrain
Photos taken on 1/28/25:
VERSION 3 + MORE
(Update May 4 2025)
IDK why I didn’t start with this cooler:
Full Screen Interactive Graph Link: https://teadb.org/humidity_temperature_graph.html
Dry Storage
Added another temp sensor to the dry, unheated storage; here’s the setup:
This drawer is enclosed completely, including from the bottom.
Full Screen Interactive Graph Link: https://teadb.org/humidity_temperature_graph2.html
Graphing Both Sensors
Full Screen Interactive Graph Link: https://teadb.org/humidity_temperature_graph3.html
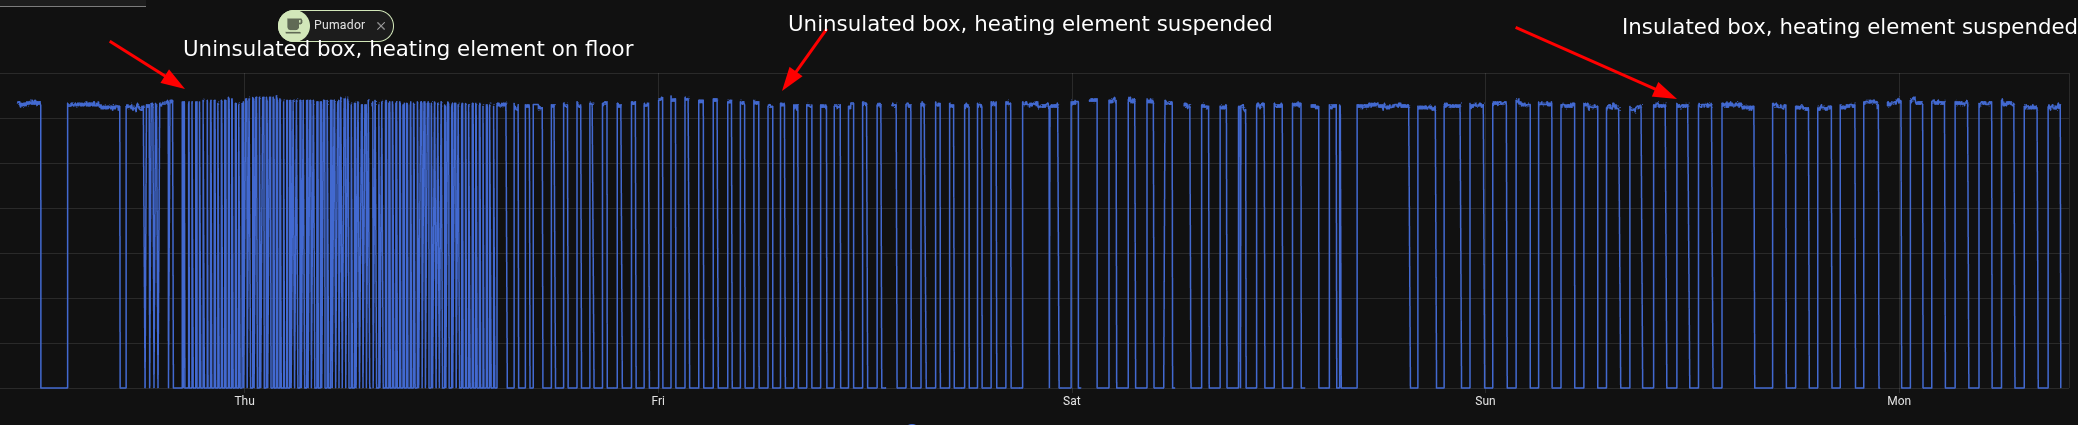
Power Data
This data visualizes how frequently the heating element turns on and off, and for how long it’s on and off.
The change of a suspended heating element makes a big difference overall.
New Home Assistant Dash